Original Articles - European Journal of Applied Engineering and Scientific Research ( 2018) Volume 6, Issue 3
In order to investigate the electrochemical effect of LixSnO1-x/G) composite (0.3 ≤ × ≤ 0.4) as an electrode material for supercapacitor application, the reduced graphene oxide (G) was synthesized using an improved modified Hummer’s method and the composites electrode material using hydrothermal reduction method. The electrode LixSnO1-x (x=0.4) gives the highest specific capacitance of 64.1 F/g, the energy density of 22.3 Wh/kg and power density of 441.1 W/kg after one cycle and after 1000 cycles CV test, it still gives the highest capacitance efficiency, equivalent to 94.6% capacitance retention. The electrode LixSnO1-x (x=0.3) gives the least specific capacitance of 61.5 F/g, energy density of 20.7 Wh/kg and power density of 330.2 W/kg after one cycle and after 1000 cycles CV test, the electrode material LixSnO1-x (x=0.3) gives the lowest capacitance efficiency, equivalent to 92.9% capacitance retention. This research highlighted the importance of introducing doped SnO in the network to reduce graphene oxide.
Graphene oxide, Capacitance, Energy density, Power density, Electrode.
The increasing demand for a reliable and sustainable source of energy for technological growth and development has facilitated an increase in funding energy-related research. The increase in the world population and advancement in technology has also created an increase in the global demand for energy use ranging from small-scale domestic applications (in terms of personal use) to large-scale industrial applications for transport and manufacturing purposes. This has led to an increasing interest in renewable energy-based research for generating a much cleaner and safer energy generation/conversion system. Therefore, there is also a need to build a reliable and efficient energy storage system to preserve the excess generated power for use when required for specific applications. Such a storage system must possess high energy and high power densities in order to provide a robust storage capacity alone with an instantaneous/rapid delivery capability respectively. Nowadays, semiconductor metal oxides, carbon materials, and conducting polymers are applied as basic pillars for electrodes [1]. The carbonaceous substances indicate best physical and chemical properties while the polymers with conductivity properties present high pseudocapacitance, low cost, conductivity, best energy density. However, EDLCs have the best pore-size and surface area. Then, pseudocapacitors with transition metal oxides materials can present excellent specific capacitance and energy storage density [1]. Carbon materials have been applied as a framework to support Na-ion host materials, such as phosphorous [2], Sn-based compounds [3], in order to increase the electronic conductivity of electrode materials during charge/discharge processes. Graphene has been widely used as effective building blocks for these purposes, owing to its high electronic conductivity, a two-dimensional structure with the high surface area, and flexibility. In order to meet the demand for high energy storage, numerous efforts have been devoted to enhance the electrochemical performance of the graphene-based composite materials based on rational material manipulations [4]. Some of the common energy storage devices in use today are batteries and conventional capacitors which are characterized with low power and energy densities respectively. Thus, an efficient high performance, low cost, and environmental safe all-in-one energy storage system which combines the properties of batteries and capacitor is required.
It is also very important to note that among tin oxide compounds, tin dioxide (SnO2) and tin monoxide (SnO) have attracted much attention due to their potential applications in optoelectronic devices such as solar cells, displays, sensors, and complementary oxide-thin film transistors [5]. The existence of different oxidation states in tin ion makes it more beneficial to have nonstoichiometric tin oxide phases. SnO2 is generally an n-type semiconductor due to the existence of intrinsic defects such as oxygen deficiencies and tin interstitials, but SnO exhibits p-type conductivity and relatively high hole mobility originated from the tin vacancy. From the literature concerned, most research work in the past has paid attention to SnO2, whereas experimental reports on SnO are fewer because of its meta-stability and tendency to transform into SnO2 at high oxygen pressures [6,7]. However, interest in SnO has been recently resurged because of the difficulty in obtaining high-quality p-type oxide semiconductors such as p-typedoped NiO and CuO. It is believed that the p-type conductivity of SnO can be further improved by proper doping [8].
Pure graphene can be modified by oxygen or other heteroatoms to show increased electrochemical capacitance. Such a gain is attributed to the redox activity enabled by the heteroatoms, known as pseudocapacitance which is the same as or comparable with the common capacitive behavior that is featured by rectangular cyclic voltammograms [9]. It is commonly considered to result from electrode surface confined electron transfer reactions and hence is Faradaic in nature [10].
Methods
The Reduced Graphene Oxide was synthesis using modified Hummer’s methods and the composite material using hydrothermal reduction method at Advanced Chemistry Laboratory, Sheda Science and Technology Complex (SHESTCO) Abuja, Nigeria. All apparatus for the synthesis were washed with distilled water and then dried in an electric oven at 60°C for 30 mins before used.
Synthesis of Reduced Graphene Oxide (G)
5 g of graphite, 2.5 g of NaNO3 and 115 mL H2SO4, (98%) were added together and stirred for 30 min using a magnetic stirrer. The mixture was then transferred into an ice bath, then 15 g KMnO4, was added slowly to the mixture and maintained at below 20°C after the KMnO4 was added, the temperature was then raised to 35°C and stirred again for another 30 min. Total 230 mL of distilled water and ascorbic acid (5 mg dispersed in 10 mL of water to produce a 0.5 mg mL-1) to aid reduction was then added slowly to the mixture and temperature raised to 98°C and stirred for another 15 min. At the end of the 15 min, 400 mL distilled water and 50 mL H2O2 at 30% was added to the mixture then filtered and then wash with 1 M HCl then with 100 mL DI water and we get a cake of the reduced graphene oxide and dried in an electric oven for 60 min.
Synthesis of Li doped SnO reduced graphene oxide (LixSnO1-x/G) composite (0.3 ≤ × ≤0.4)
10 mg of the G was dispersed in 20 mL of water to produce a 0.5 mg mL-1 completely water dispersed G.
1. G solution (0.5 mg mL-1) was mixed with 10 mL of water containing (7 mg SnCl2.2H2O and 3 mg Li2CO3), ascorbic acid (5 mg dispersed in 10 mL of water to produce a 0.5 mg mL-1) to aid reduction and 10 mL of ethanol to aid homogeneity for the synthesis of Li0.3SnO0.7/G composite
2. G solution (0.5 mg mL-1) was mixed with 10 mL of water containing (6 mg SnCl2.2H2O and 4 mg Li2CO3), ascorbic acid (5 mg dispersed in 10 mL of water to produce a 0.5 mg mL-1) to aid reduction and 10 mL of ethanol to aid homogeneity for the synthesis of Li0.4SnO0.6/G composite
The whole mixtures in 1 and 2 were sonicated at 60°C for 3 h in a bath sonicator. After sonication, the sample is then dried in an electric oven at 60°C for 60 min.
Electrochemical analysis
The electrochemical analyses of the samples were carried using Cyclic Voltammetry and Electrochemical Impedance Spectroscopy (EIS) tests from a CH1604E Electrochemical Analyser, controlled by EC-Lab VlO.37 software. The CH1604E Electrochemical Analyser is an electronic instrument designed to control the potential difference (E) applied to the working electrode (WE) with a current flow (in form of either a half cell or a full cell), a reference electrode (RE) with no current and the counter electrode (CE) through which current leaves the electrolyte while measuring the potential difference between the WE and RE. The CH1604E Electrochemical Analyser generates characteristic cyclic voltammetry curves which give us information on the possible thermodynamics of electrochemical reactions of the system. The specific parameters applied for the cyclic voltammetry are; the initial voltage of 0.0, the final voltage of 1.3 V, the maximum current range of 100 mA and a scan rate of 100 mV/s. The specific parameters applied for the electrochemical impedance spectroscopy are; DC voltage of 0.0, Amplitude (AC voltage) of 0.005 V low-frequency value of 0.1 Hz, the high-frequency value of 100,000 Hz and running time of 250 s.
All tests in this study were carried out in a three-electrode configuration with the active material serving as the working electrode, a carbon rod serving as the counter electrode and Ag/AgCl serving as the reference. A 2 M KOH aqueous solution serves as the electrolyte which provides a medium for current flow and ion interaction. Although the nature of electrolyte is very important for an efficient enhancement of the performance of supercapacitors, comparison of different electrolyte types is not within the scope of this work.
Results and discussion on structural properties
The structural properties of the composite materials were analyzed using the following characterization; the Raman analysis, SEM and XRD.
Raman analysis
Figure 1 gives the Raman spectra of the LixSnO1-x (0.3 ≤ × ≤ 0.4) graphene composites.
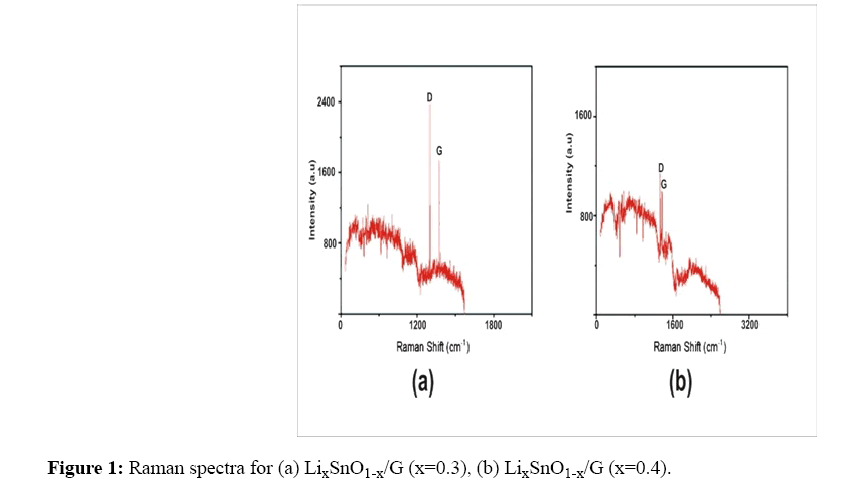
Figure 1: Raman spectra for (a) LixSnO1-x/G (x=0.3), (b) LixSnO1-x/G (x=0.4).
The Raman spectra for the samples were obtained using OriginPro 2018 software and provide the best signature for characterization of graphene samples and composites. The D band is the defects and disorder mode in the reduced graphene oxide and its composite material, while the G band is the sp2-bonded vibration from carbon atoms (hexagonal lattice of graphite). The G and the D band are due to the bond stretching of all pairs of sp2 atoms and the vibrating modes of the sp2 bond 5
From Figure 1, the Raman shift for the composites gives a D band value of about 1348 cm-1 and a G band value of about 1500 cm-1. The Raman shift gives the ID/IG intensity ratio of 1.04. From Figure 1 a shift of the D band intensity was observed for all the composites. This shift may have originated from structural distortion of the reduced graphene oxide this may have been caused by the different bond distances of C-C atom and C-Li, C-Sn atoms owing to the introduction of the 3D doped metal oxide in graphene networks [11,12]. The Li dopants interact with the Sn4+ providing additional active sites in the composite material which results in a strong coupling between the metal species and the reduced graphene oxide, resulting in a shift in the D band. The shift in the D band intensity may also be due to a slight change in temperature during the synthesis of the composite material.
From the relatively high intensities of the D and G band, it can be concluded that the size of the sp2 domains increases during the reduction of the graphene oxide. From Figure 1, the decrease in the intensities of the G band relative to the D band was also observed for the composite material, this demonstrated that defect are more easily introduced into thinner reduced graphene oxide sheet which is as a result of the stretching of the sp2atom, which can be attributed to the presence of the 3D doped metal oxide within the layers of the graphene, this agrees with the report [13]. This decrease in the G band intensities relative to D band in the composites materials reveals the disorder present in the sample, which can facilitate the trapping of ions from the electrolyte. The presence of the only D and G band in the composite material is a clear indication of the incorporation of the doped metal oxide into the reduced graphene oxide and this reflects the good crystallinity of the doped metal oxide in the composite material.
SEM analysis
Figure 2 give the SEM images of LixSnO1-x/G (x-=0.3), LixSnO1-x/G (x=0.4).
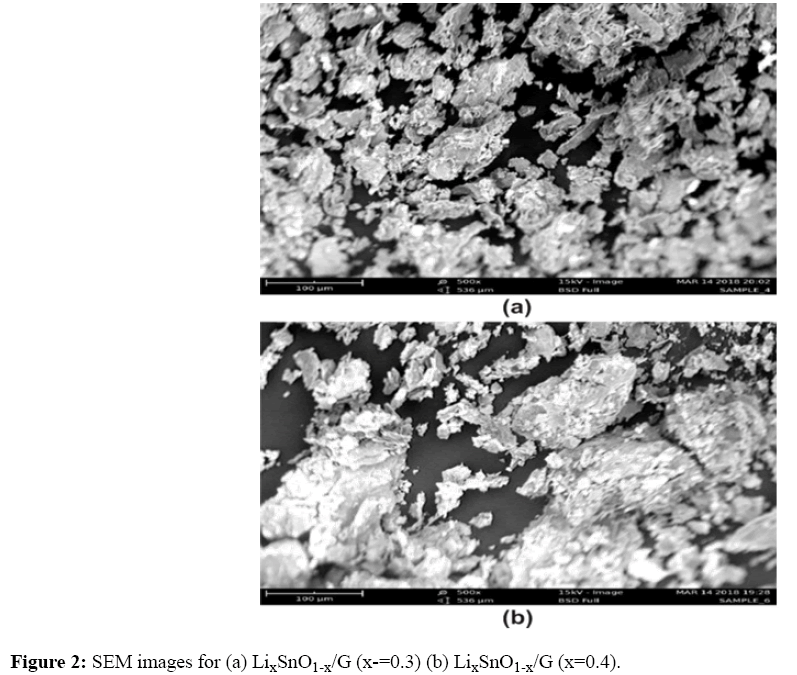
Figure 2: SEM images for (a) LixSnO1-x/G (x-=0.3) (b) LixSnO1-x/G (x=0.4).
From Figure 2, a relatively uniform porous surface structure was observed in the doped metal oxide graphene composites and was observed to increase with an increase in the doping concentration for the composite materials. The SEM images indicate that there was a slight increase in the number of grain boundaries, signifying a breakdown of the surface coalescence with increasing dopant concentration. However, since all the samples were synthesis under identical conditions, an almost similar microstructure and surface morphology were seen in all the doped metal reduce graphene electrode composites irrespective of the doping concentration.
Graphene layers interacting by means of Van der Waals forces [14] and form an open pore system, through which electrolyte ions can easily access the surfaces of the graphene, which facilitate the formation of electric double layers and improve the electrochemical utilization of Li, and Sn nanoparticles into the network of the composite electrode. The doped metal oxides improve the accessibility due to their metal-cation and regular 3D dispersion in the structure of the electrode. Agglomeration adversely affects the performance of the reduced graphene oxide as an electrode by preventing electrolyte ions from penetrating into the reduced graphene oxide layers [15]. The doped metal oxide is being used as a spacer to prevent agglomeration, and thus avoid the loss of their high active surface area which ensures high electrochemical utilization of the reduced graphene oxide and also contributes to the total capacitance.
The SEM images in Figure 2 shows that the doped metal oxide is sandwiched chemically within the layers of the reduced graphene oxide, resulting in 3D architecture material and reveals good quality dispersion. The lateral grain size of the reduced graphene oxide and composites material exhibits a wide distribution, ranging from 80 μm to 100 μm.
XRD analysis
The crystal structures of LixSnO1-x/G (x=0.3), LixSnO1-x/G (x=0.4) nanocomposites have been characterized by Xray Diffraction (XRD) with a CuKa1 radiation source of wavelength 1.5406 Å. Figure 3 gives the XRD diffractograms of the composites.
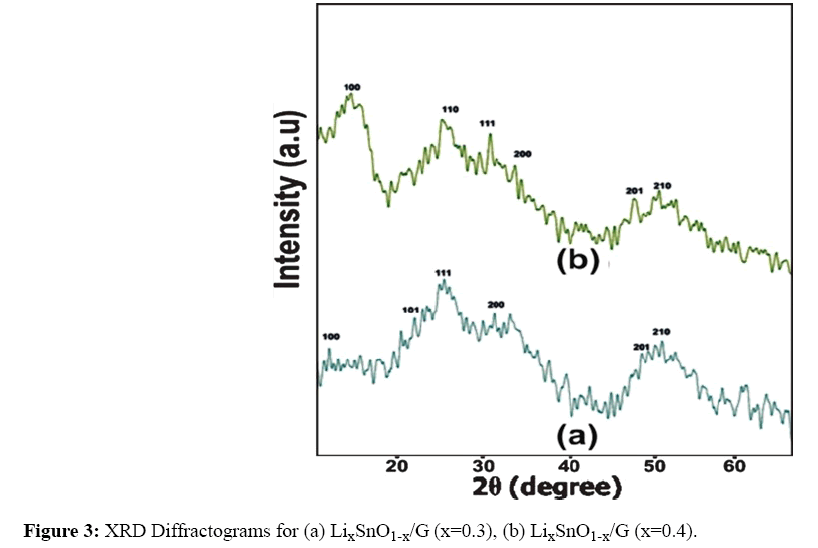
Figure 3: XRD Diffractograms for (a) LixSnO1-x/G (x=0.3), (b) LixSnO1-x/G (x=0.4).
Figure 3(a) shows the XRD diffractograms of the composite material NaxSnO1-x/G (x=0.3) with Bragg diffraction peaks at 2θ values of 10.370, 16.210, 21.270, 32.070, 47.800 and 55.010, correspond to (100), (101), (111), (211), (200) and (321) reflections planes respectively which is well indexed to the pure tetragonal rutile phase (JCPDS card no. 71-5324). Figure 3(b) show the XRD diffractograms of the composite material NaxSnO1-x/G (x=0.4) with Bragg diffraction peaks at 2θ values of 10.370, 16.210, 21.270, 32.070, 47.800 and 55.010, correspond to (100), (101), (111), (211), (200) and (321) reflections planes respectively which is well indexed to the pure tetragonal rutile phase (JCPDS card no. 51-0556).
The XRD Diffractograms were obtained using OriginPro 2018 software with the FWHM for the peaks estimated using a Gaussian function. The preferred orientations is along the peaks with the planes (100), (101) and (111) reflections and have a relatively high intensity which of course is directly proportional to the number of diffracting particles (atoms or groups of atoms) for the entire sample irrespective of the doping concentration and have tetragonal rutile-type structure. This indicates improving ordering of the reduced graphene oxide along the stacking direction due to the presence of the doped metal oxide and also due to change in electron density in the conduction band because of the introduction of active cations (Li+) in the reduced graphene oxide material, this agrees with the report [1]. The broad peaks indicate the stacking direction comprising largely of reduced graphene oxide [7]. This is as a result of early crystallization. That might still be due to oxygen group insertion between the layers of the reduced graphene oxide which may cause increase interplanar distance. Particle size distribution at a size of agglomeration may also be responsible for the unexpected reduction in the peak intensities for the LixSnO1-x/G electrode composites. This agrees with the work of [16,17]. This reduction in the peak intensities for the LixSnO1-x/G electrode composites may also be due to the incorporation of Li+ ion (0.74 Å) into the SnO host lattice forming the composite with the reduced graphene oxide, which may affect lattice scattering, resulting in the decreased peak intensity. This agrees with the report of [10,18].
It is also possible that smaller particles form agglomerates that are of similar size to the primary particles of the reduced graphene oxide. In general the reflection planes in the reduced graphene oxide sample are very poorly order along the stacking direction revealing that the reduced graphene oxide comprises largely free graphene sheet but with little of insertion of interplanar oxygen group, this agreed with [8,19], while the reflection planes in the composite materials reveal improving ordering along the stacking direction.
Results and discussion on electrochemical analysis
The electrochemical properties of the composite materials were analyzed using Cyclic Voltammetry (CV) and the Electrochemical Impedance Spectroscopy (EIS) analysis.
The cyclic voltammograms from the Cyclic Voltammetry analysis for LixSnO1-x/G (x=0.3) and LixSnO1-x/G (x=0.4) at the scan rate of 100 mVs-1 are given in Figure 4. The Nyquist plot from the Electrochemical Impedance Spectroscopy analysis for LixSnO1-x/G (x=0.3) and LixSnO1-x/G (x=0.4), composites electrode materials is given in Figure 5.
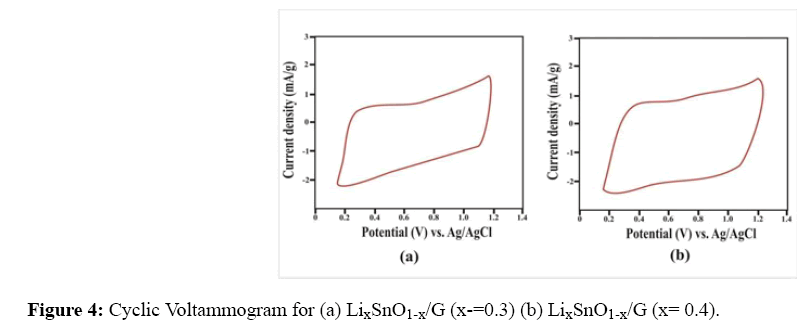
Figure 4: Cyclic Voltammogram for (a) LixSnO1-x/G (x-=0.3) (b) LixSnO1-x/G (x= 0.4).
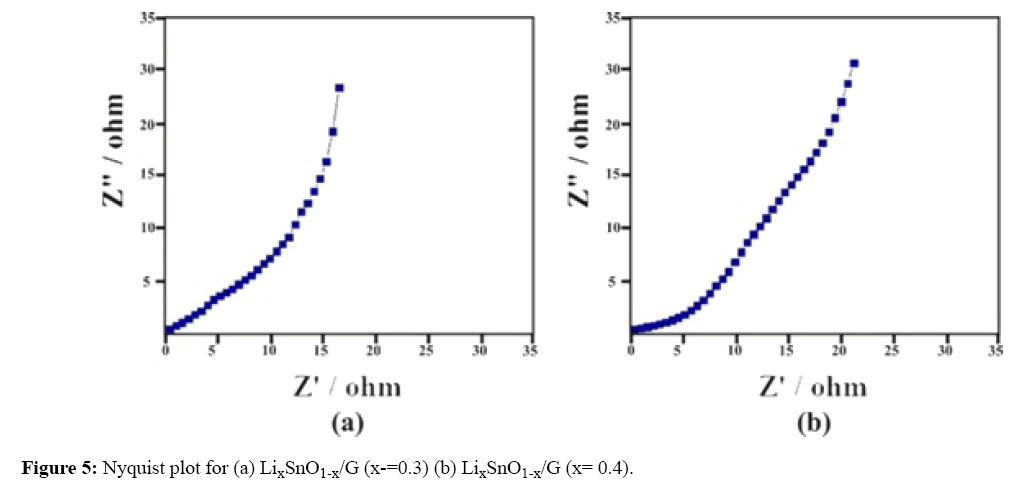
Figure 5: Nyquist plot for (a) LixSnO1-x/G (x-=0.3) (b) LixSnO1-x/G (x= 0.4).
The specific capacitance (Csp) was calculated using the equation;
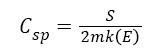
Where Csp is the specific capacitance, S is the total charge surface area, m is the mass of the electrode material, k is the scan rate and E is the value of the electrode potential.
The energy density (ED) and power density (PD) were calculated using equations
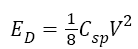
Where C is the specific capacitance in F/g, V is the electrode potential in volts
The power is the energy expended per unit time and since the capacitor usually consists of the current collector, electrode and dielectric material, there will be an associated Equivalent Series Resistance (ESR) from these extra components. As such; the associated maximum power density the cell can deliver is expressed as:
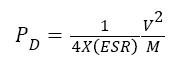
Where ESR is the equivalent series resistance and M is the total mass of active material. The values of the equivalent series resistance (ESR) for the composites electrodes were obtained from the Nyquist plot in Figure 5. The summary of the results from the electrochemical analysis is given in Table 1.
| Composite | Mass (g) | Csp (F/g) | ERS (Ω) | ED(Wh/kg) | PD (W/kg) |
|---|---|---|---|---|---|
| LixSnO1-x/G (x=0.3) | 0.229 | 61.5 | 4 | 20.7 | 330.2 |
| LixSnO1-x/G (x=0.4) | 0.237 | 64.1 | 3.2 | 22.3 | 441.1 |
Table 1: Summary of results from the electrochemical analysis for one cycle.
The electrochemical properties and capacitance measurement of the composite electrodes were studied using three electrode system by cyclic voltammetry (CV) and electrochemical impedance spectroscopy (EIS). The CV curves give a quasi-rectangular shape due to the kinetics of electron transportation in the electrode material and the ion adsorption-desorption at the electrode and electrolyte interface and also due to the substantial contribution of pseudocapacitance to the system. This also agrees with a report from 33.
From Table 1, it was observed that there was an increase in the energy density, power density and specific capacitance of the composites electrodes with an increase in a doping concentration of the cations (Li) in the composite electrodes. This is due to the expansion of the active sites when the 3D LixSnO1-x, (0.3 ≤ × ≤ 0.4) materials were introduced into the network of the reduce graphene oxide. This agrees with the work of authors [6,20]. The increase in the capacitance is due to the mixed proton-electron conductivity from the cations and the electrolyte ions. This increase in energy and power density with increase in doping concentration is also attributed to an increase in the charge surface area which decreases diffusion distance, this could be attributed to high Li+ diffusion coefficient, since ions diffusion is one of the most crucial processes that control the redox reaction within the electrode material [21], which can be link to decrease crystallite size as observed from XRD characterisation. The greatly enhanced specific capacitance for the composite is probably due to the synergetic effect between the reduce graphene oxide and the LixSnO1-x (0.3 ≤ × ≤ 0.4) material. This not only effectively inhibit the stacking/ agglomeration of the reduce graphene oxide but also improving the high electrochemical utilization of the composites electrodes.
The EIS analysis is a powerful and informative technique which determines the rate that the electrode material can be charge/discharge, therefore an important factor in determining the power density and to evaluate the properties of conductivity and charge transport in the electrode/electrolyte interface [14]. In order to gain insight on the intrinsic electrochemical properties of the composite electrode, EIS measurement was carried within the probed frequency range of 100,000 to 0.1 Hz. It can be clearly observed that the impedance curves from Figure 5 consist of an arc and followed by a slanted line in the low-frequency region. While in the high-frequency region, the intercept of the semicircle on the real axis of the Nyquist plot represents the solution equivalent series resistance which can be correlated to the Ohmic resistance of the electrolyte in the system and the charge transfer resistance between the interface of the electrode materials and the electrolyte. The Warburg impedance is related to the diffusional impedance of the electrochemical system which is employed to fit the straight line at the intermediate frequency, followed by a near vertical line at the lower frequency region [18,22]. From Table 1, a decrease in ESR for all composite with an increase in doping concentration was observed. This is due to the increase in the current response with an increase in doping concentration. The decrease in the value of the ESR implies, the improve conductivity of the composite electrode and this enhances their capacitive performance, which is in accordance with the results obtained from the CV measurement. This decrease in ESR resulted in the increase in power density for the composite electrodes.
The cyclic stability of the electrode material is a crucial and important parameter to rank the performance of the energy storage application [7,23]. The electrochemical stability of the composites electrodes was evaluated by repeating the CV test between 0.0 and 1.3 V at a scan rate of 100 mV/s for 1000 cycles under the same condition of the electrochemical set-up applied for one [24-30]. The composites electrode showed a greatly improved cycling stability and demonstrated the positive synergistic effect of LixSnO1-x (0.3 ≤ × ≤ 0.4) material with the reduce graphene oxide as ca omposite electrode to meet the requirement for high energy and power density [31-37]. The electrode LixSnO1-x (x=0.4) after 1000 cycles CV test, it gives 60.6 F/g with the highest capacitance efficiency, equivalent to 94.6% capacitance retention. The electrode LixSnO1-x (x=0.3) after 1000 cycles CV test, it gives 57.1 F/g with the lowest capacitance efficiency, equivalent to 92.9 % capacitance retention.
The electrode LixSnO1-x (x=0.4) gives the highest specific capacitance of 64.1 F/g, energy density of 22.3 Wh/kg and power density of 441.1 W/kg after one cycle and after 1000 cycles CV test, the electrode material LixSnO1-x (x=0.4) gives the highest capacitance efficiency, equivalent to 94.6% capacitance retention. The electrode LixSnO1-x (x=0.3) gives the least specific capacitance of 61.5 F/g, energy density of 20.7 Wh/kg and power density of 330.2 W/kg after one cycle and after 1000 cycles CV test, the electrode material LixSnO1-x (x=0.3) gives the lowest capacitance efficiency, equivalent to 93.2% capacitance retention.
The authors acknowledge the technical support of the Advanced Chemistry Laboratory, Sheda Science and Technology Complex (SHESTCO) Abuja, Nigeria and Solid State Physics and Material Science Laboratory, University of Nigeria Nsukka.