Research Article - Annals of Biological Research ( 2018) Volume 9, Issue 2
Inadequate knowledge on fertilizer usage and poor financial resources are among the reasons for low maize productivity under small-scale farming. Fertilizer micro-dosing may increase food production by using low rates which are affordable by most resource poor farmers and have a high investment return. A two-year field experiment was conducted on sandy loam and sandy clay soils being typical representatives of sub-humid tropical agroecological zones. A split-plot design involved di-ammonium phosphate (DAP), Minjingu mazao (MM) and triple super phosphate (TSP) as main plots and fertilizer micro-dose rates of 10 kg N and 5 kg P/ha, 20 kg N and 10 kg P/ha, 40 kg N and 20 kg P/ha, 60 kg N and 30 kg P/ha, recommended rate 80 kg N and 40 kg P ha-1 and control as sub-plots. Phosphate fertilizers that produced highest grain yield were MM (2317 kg/ha), followed by DAP (2173 kg/ha) and TSP (2115 kg/ha). Fertilizer micro dose rates (10 kg N and 5 kg P/ha; 20 kg N and 10 kg P/ha) increased the yield by 90.5 and 136.6% from 1012 kg/ha in control, respectively. Intermediate rates (40 kg N and 20 kg P/ha) and (60 kg N and 30 kg P/ha) produced average grain yields of 2629 and 2647 kg/ha while the recommended rate produced 2601 kg/ha. The highest grain yield was 3910 kg/ha from MM at 40 kg N and 20 kg P/ha. Considering the micro-dose options therefore, MM fertilizer and micro dose
Fertilizer micro-dosing, Growth analysis characteristics, Phosphate fertilizers, Recommended fertilizer, Relative agronomic effectiveness
Maize (Zea mays L.) is the most popular and important crop in Tanzania and in other sub-Sahara African (SSA) countries as it is grown for food and cash. The estimated average consumption, for instance in Tanzania is 128 kg/ person/year [1] but the average maize yield is 1.2 t/ha which is far less than its potential of 6 to 7.5 t/ha [2]. The low yield leads to perpetual self-insufficiency in maize availability.
Low maize productivity is attributed mainly to declining soil fertility, climate changes and poor agronomic practices. Continuous farming and low or no use of fertilizer accelerates nutrient mining in the soil [3]. Only few farmers use inorganic fertilizers where the main nutrient supplied is nitrogen (N) followed by phosphorus (P) which are also the most limiting nutrients in maize farming [4].
Reasons for low fertilizer adoption in crop production by smallholder farmers are mainly inadequate knowledge on fertilizer usage such as type, rate, time, method and fertilizer benefits [5]. Also, most smallholder farmers are resource poor, therefore they cannot afford to buy and apply fertilizers at recommended rates. This condition necessitates the need to introduce the fertilizer micro-dose technology in sub-humid tropics. Micro-dose technology addresses fertilizer placement with a rate of about a third to a fourth of the usual rate recommended by research or advisory services [6]. Micro-dose technology enables farmers to start with the lowest-cost effective technology and gradually move to higher capital-intensive technologies as their resources increase [7,8]. Also, fertilizer micro-dose reduces the risk of crop failure and fertilizer poisoning in areas where rainfall is erratic and harsh weather conditions [9]. A long term study on the use of fertilizer micro-dose in the Sahel suggests that sustainability of this technology on highly degraded soil is improved by combined application of organic matter [7,10,11]. There are positive effects on the use of fertilizer micro-dosing technology by smallholder farmers in arid and semi-arid Sub-Saharan African countries [7,11-13]. These studies found that 125 kg/ha of N19P19K19 fertilizer was appropriate micro-dose rate in sorghum and millet cultivated under semi-arid conditions of Sahel. Recent studies reported 27 kg DAP and 27 kg Urea/ha in semi-arid Ethiopia [14], NPK (N20P40K20 and N0P40K20) in humid forest areas in Ghana [15], 37.5 kg N and 13 kg P/ha in Kenya [16] as micro-dose fertilizer rates in maize. Studies on straight fertilizers like TSP and multiple nutrients fertilizers such as MM which supplies both macro and micro-nutrients under sub-humid tropical conditions at micro-dose rates developed for smallholder farmers in maize crop production have not been done. Therefore, this study will provide information about straight and multiple nutrients fertilizers and micro-dose rates in maize production under sub humid tropical areas.
Field experiments were carried out in two case study villages in sub-humid Tanzania. Different micro-dose rates were compared against farmers’ practices and nitrogen (N) and phosphorus (P) recommended application rates [4]. The study involved use of different types of P fertilizers compared with blended fertilizers like Minjingu Mazao (MM) so as to provide micro nutrients, which are increasingly becoming limiting in Tanzania [17]. The study was conducted in the framework of a large participatory research project [18]. The focus here was to increase food production through fertilizer micro-dosing rates that would be affordable by most smallholder poor resource farmers and give high investment return. Objectives of the study were to determine the effectiveness of selected phosphate fertilizer types on maize growth and yield under different soil conditions and assess the effects of N and P micro-doses on growth and yield of maize.
Description of the study area
The study was conducted in Kilosa District, Morogoro Region during 2014/2015 and 2015/2016 cropping seasons. Rainfall there is bimodal where the short rain season starts in October and ends in January and the long rain season starts from mid-February and ends in May. The mean annual rainfall ranges between 800 and 1400 mm while the average ambient temperature is about 25°C [19]. The experiment was conducted in Changarawe village (06°54ʹ55ʺS, 036°57̍10ʺE and 500 m above sea level) in Masanze ward and Ilakala village (07°08ʹ39ʺS, 036°54ʹ05ʺE and 605 m above sea level) in Ullaya ward. The villages are located 25 km apart from each other.
Experimental design, treatments and management
Maize variety used was TMV1-OPV (taking 110 days to mature) [20]. Inorganic fertilizers applied were di ammonium phosphate (DAP) ((NH4)2HPO4) with 18% N and 46% P2O5 [21], Minjingu Mazao (MM) containing 10% N and 20% P2O5, 25% CaO, 5% S, 1.5% MgO, 0.5% Zn and 0.1% B [22] and triple super phosphate (TSP) that contained 46% P2O5 and urea which had 46%N [23].
Experiments were initiated in December 2014 and February 2015 in Ilakala and Changarawe villages, respectively. The field experimental design was a split-plot laid out in a randomized complete block design (RCBD) [24]. The main plot was phosphate fertilizers that were DAP, MM and TSP. The sub-plots were fertilizer application rates at 0 (no fertilizer use) as farmer practice; micro-dose rates (5 kg P and 10 kg N/ha; 10 kg P and 20 kg N/ha); intermediate rates (20 kg P and 40 kg N/ha; 30 kg P and 60 kg N/ha); and recommended rates of 40 kg P and 80 kg N/ha [4]. DAP and TSP fertilizers were applied by separate hole placement, MM was applied by broadcasting followed by incorporation into the soil because of low solubility [25]. Urea was applied at fifth leaf collar visible (V5) [7]. The crop spacing used was 0.75 m by 0.30 m with 8 rows per plot and 10 plants per row giving plot size of 18 m2. At Ilakala site, maize crop was sown on 25 January 2015 and 14 January 2016 while at Changarawe site sowing was done on 8 March 2015 and 20 January 2016 by dibbling method. Two seeds per hole were sown and thinning was done at seedling stage (V2). Agronomic practices and crop management included weeding three times, which were at seedling stage (V2), fifth leaf stage (V5) and tasseling (VT). Stalk borers, aphids and other insects were controlled by spraying insecticide KUNG FU 5 EC (50 g/L Lambda-cyhalothrin) by mixing 20 mL of insecticide in 15 L Knap sack sprayer [26].
Data collection
Soil sampling and laboratory analysis
Soils were sampled before establishing experiments and analysed [27] where ten spots were sampled at depth of 0-15 cm and 15-30 cm. Quartering method was used to get composite soil sample which was transferred to Soil Laboratory for analysis. Soil analysis included particle size distribution for textural class by Hydrometer method, soil pH by pH meter in 1:2.5 soil-water, organic carbon by Walkley-Black Method, total nitrogen by micro-Kjedahl digestion method, available phosphorus by Bray and Kurtz, exchangeable cations (Ca2+, Mg2+, K+, Na+) by NH4- acetate filtrates by ammonium acetate saturation and available micronutrients (Zn, Cu, Mn and Fe) by the DTPA extraction method.
Weather data
At both sites, daily weather data on rainfall (mm) was recorded using standard rain gauges type that were installed in the experimental fields during the 2014/2015 and 2015/2016 cropping seasons.
Nutrient concentration and uptake in plants
Five plants were selected randomly at sixth leaf growth stage (V6) and cut at five centimeters above the ground as described by Hochmuth, et al. [28]. Samples were oven dried at 80°C and plant tissue analysis was done according to Fageria et al. [29]. The nutrients analysed include N, P, K, S and Zn. Furthermore, nutrient uptake was determined using the equation described by Fageria et al. [29] with some modification that nutrient concentrations in percentage were changed into mg/kg by multiplying by 10,000 and later on changed into g/kg and kg/kg of dry plant materials to get kg nutrient/ha as follows:
Nutrient uptake (kg/ha)=TDM (kg/ha) × Nutrient content in plant (kg/kg) (1)
Growth analysis and total dry matter
Growth analysis characteristics were determined by sampling five plants randomly at sixth leaf growth stage (V6), silking (R1) and dough growth stage (R4) [30]. Length and width of leaves was measured using a ruler and leaf area (LA) was calculated from the equation described by Ogoke et al. [30] as follows:
LA=Length of leaf (cm) × Maximum width of leaf (cm) × 0.75 (a constant factor for maize leaves) (2)
Total dry matter (TDM) was determined as described by (CIMMYT,2013); dry weight was measured by using the Advanced Electronic Balance ENDEL™ K-3000BH. Crop growth rate (CGR) and leaf area index (LAI) were determined using the methods [29] as follows:
LAI=LA/GA (3)
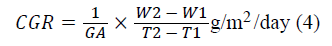
Where, GA is ground area covered, LA is leaf area, T1 and T2 are time intervals at different growth stages, W1 and W2 are weights of dry matter at different growth stages.
Total dry matter (TDM) at sixth leaf growth stage (V6), silking (R1), dough stage (R4) and harvesting stage were determined by sampling five plants randomly and oven drying to constant weight as described [31].
Yield components and grain yield
Yield components determined included plant population at harvest, number of cobs per plant, the number of grains m-2 and seed size (g/100 seeds). Yield involved the biological yield and grain yield per ha which was converted from grain yield in gm-2 at harvest maturity [31].
Data analysis
Soils, weather and nutrient concentration data were subjected to descriptive statistics.
Crop growth and yield data were analysed using the analysis of variance (ANOVA) at p ≤ 0.05 basing on the statistical model for the split-plot design as follows:

Where: Yijk=Response level, μ=General effect or general error mean, βi=Block effect, Aj=Main plot effect, δij=the main plot random error (Error a), Bk=Sub-plot effect, ABik=Interaction effect between the main plot and the subject and εijk=Sub-plot random error effect (Error b).
Comparison of means was done with Tukey’s test at p ≤ 0.05 as described [24]. Coefficient of determination (R2) and correlation coefficient (r) analysis for micro-dose fertilizer rates vs. yield was performed as described [24,32].
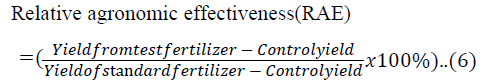
Relative agronomic effectiveness for MM fertilizer as a test fertilizer and standard fertilizer (DAP or TSP) was calculated using the equation described [33] as follows:
Soil and weather description
Soil characteristics at the study sites are shown in Table 1. Soils at Ilakala study site were sandy loam and sandy clay at 0-15 cm and 15-30 cm, respectively. Soil pH was neutral (6.6-7.3) with low total nitrogen (0.10-0.20%), medium organic carbon (1.26-2.50%) and phosphorus (7-20 mg/kg). Exchangeable cations were medium to high except sodium which was low. Micronutrients determined were medium to high except for zinc which was low in both sites. Soils at Changarawe study site were sandy clay loam and sandy loam at 0-15 cm and 15-30 cm, respectively, soil pH was medium acidic (5-6.0). Total nitrogen (N), organic carbon (OC) and phosphorus (P) were very low.
| Soil characteristics | Ilakala (0-15 cm) | Ilakala (15-30 cm) | Chanagarawe (0-15 cm) | Changarawe (15-30 cm) |
|---|---|---|---|---|
| Sand (%) | 66.24 | 69.52 | 62.24 | 77 |
| Clay (%) | 26.48 | 26.48 | 30.48 | 14 |
| Texture class | Sandy Loam | Sandy Clay | Sandy Clay Loam | Sandy Loam |
| Soil pH | 6.92 neutral | 7.10 neutral | 5.52 strongly acid | 5.33 strongly acid |
| Total nitrogen (%) | 0.10 L | 0.20 L | 0.06 VL | 0.04 VL |
| Organic carbon (%) | 2.09 M | 2.00 M | 0.93 L | 0.80 L |
| P-Bray 1 (mg/kg) | 19.77 M | 10.21 M | 2.86 L | 2.75 L |
| Exchangeable potassium (cmol+/kg) | 1.15 H | 0.64 M | 0.80 M | 0.72 M |
| Exchangeable magnesium (cmol+/kg) | 0.75 M | 0.70 L | 1.89 H | 1.72 H |
| Exchangeable calcium (cmol+/kg) | 13.77 VH | 15.23 VH | 3.89 M | 3.89 M |
| Exchangeable sodium (cmol+/kg) | 0.10 L | 0.09 VL | 0.24 L | 0.26 L |
| Copper (mg/kg) | 0.36 M | 0.26 M | 0.24 M | 0.26 M |
| Zinc (mg/kg) | 0.58 L | 0.34 L | 0.91 M | 0.58 L |
| Iron (mg/kg) | 20.73 H | 13.45 H | 38.76 H | 41.68 H |
| Manganese (mg/kg) | 43.30 H | 36.70 H | 42.80 H | 47.50 H |
Table 1: Soil characteristics at Ilakala and Changarawe study sites; Letters in parenthesis represent abbreviation for remarks according to Landon [34] where H: High, L: Low, M: Medium, VH: Very High, VL: Very Low
Rainfall results for 2014/2015 and 2015/2016 cropping seasons are presented in Figure 1. At Ilakala, a total amount of rainfall in 2014/2015 cropping season was 496 mm while in 2015/2016 was 805 mm. There was an inter-seasonal as well as intra-seasonal variation in rainfall amount. Distribution was not even during both cropping seasons. In 2015, there were no rains which coincided with seedling and sixth leaf growth stages while at boot and tasseling there was high rainfall (7-9 weeks after planting). From silking (11 weeks after planting) to dough stage (13 weeks after planting) there was moderate amount of rainfall (30-50 mm) and well distributed rainfall pattern. In 2016, rainfall increased from 25 mm at emergence to 110 mm at fourth leaf stages and decreased to 34.5 mm at boot and tasseling stage (7 to 9 weeks after planting). From milk stage to maturity (11 to 15 weeks after planting) rainfall amount was very high (90 mm ≤).
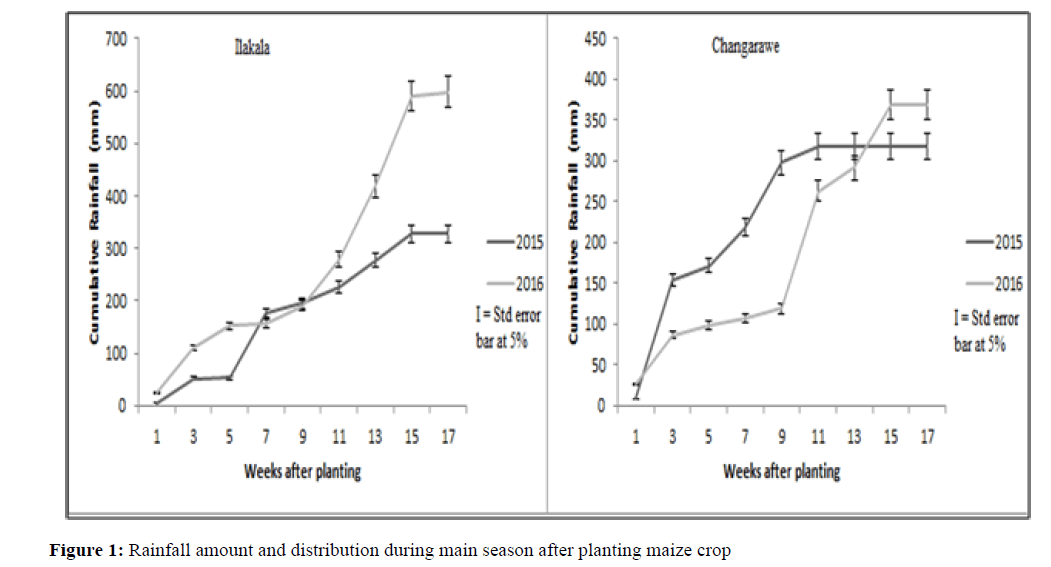
Figure 1: Rainfall amount and distribution during main season after planting maize crop
In Changarawe, total amount of rainfall received was 349.5 mm during 2015 cropping season and 579.3 mm in 2016. During 2015 cropping season, there was low rainfall at emergence growth stage of 8 mm followed by high amount of rains amounting to 154.6 mm at seedling and fifth leaf (1st and 3rd weeks after planting), respectively. From boot stage to milk stage (7 to 11 weeks after planting) there was high amount of rainfall which decreased towards dough and maturity stage. In 2016, amount of rainfall increased from sowing to third week after planting (26.5 to 86.0 mm) and decreased rapidly to about 10 mm between sixth leaf and silking stage (5th and 9th weeks after planting).
Nutrient concentrations in maize plants
Different fertilizer types and micro-dose rates significantly affected the nutrients concentrations at Ilakala study site during 2015 and 2016 as shown in Table 2. Nitrogen (N) concentration increased from control to different fertilizer rates with maximum at recommended rate during 2015 while during 2016 the maximum N was at intermediate rates. Phosphorus (P) concentration increased from control to fertilizer rates and reached maximum at both intermediate and recommended rates during 2015 and 2016 years. Concentration of potassium (K) increased from control to different fertilizer rates and reached maximum at micro-dose, intermediated and recommended rates during 2015 and 2016. Sulphur (S) concentration increased from control to micro-dose rates and decreased towards recommended rate in DAP, MM and TSP plots. Zinc (Zn) concentration had irregular trends increasing from control to micro-dose rates and decreased towards recommended rate in MM, DAP and TSP fertilizer plots.
| Treatment | N (%) 2015 | N (%) 2016 | P (%) 2015 | P (%) 2016 | K (%) 2015 | K (%) 2016 | S (%) 2016 | Zn (ppm) 2015 | Zn (ppm) 2016 |
|---|---|---|---|---|---|---|---|---|---|
| DAP1 | 1.25a | 1.88a | 0.15a | 0.21a | 1.39a | 1.32a | 0.17abcd | 5.84c | 20.08ghi |
| DAP2 | 1.26a | 2.35f | 0.32i | 0.24de | 1.93h | 2.32cd | 0.22g | 10.51g | 14.97bc |
| DAP3 | 1.58d | 2.14bc | 0.29h | 0.25e | 1.87g | 2.54fg | 0.24h | 6.19c | 21.02jk |
| DAP4 | 1.69f | 2.66i | 0.32i | 0.27f | 1.84f | 2.67i | 0.26i | 11.16h | 19.50efgh |
| DAP5 | 1.88h | 2.46g | 0.40j | 0.24de | 1.86g | 2.27c | 0.16ab | 7.18d | 14.88b |
| DAP6 | 1.96i | 2.53h | 0.27g | 0.27f | 1.67d | 2.36d | 0.17abcd | 4.54b | 14.13a |
| MM1 | 1.26a | 1.88a | 0.15a | 0.21a | 1.38a | 1.33a | 0.157a | 5.85c | 20.38ij |
| MM2 | 1.47b | 2.16c | 0.23e | 0.27f | 1.71e | 2.56g | 0.17bcde | 8.51e | 18.82e |
| MM3 | 1.55c | 2.45g | 0.25f | 0.27f | 1.67d | 2.44e | 0.177cde | 9.84f | 17.23d |
| MM4 | 1.45b | 2.73j | 0.22d | 0.23cd | 1.57c | 2.32cd | 0.22g | 9.85f | 15.77c |
| MM5 | 1.55c | 2.12b | 0.23e | 0.24de | 1.95i | 2.04b | 0.26i | 8.52e | 21.51k |
| MM6 | 1.75g | 2.17c | 0.43k | 0.29g | 1.54b | 2.66hi | 0.24h | 4.56b | 19.74ghi |
| TSP1 | 1.25a | 1.89a | 0.15a | 0.21a | 1.38a | 1.32a | 0.16abc | 5.71c | 20.30hij |
| TSP2 | 1.69f | 2.24d | 0.17b | 0.22bc | 1.39a | 2.53fg | 0.19f | 3.16a | 19.62eghi |
| TSP3 | 1.65e | 2.31e | 0.19c | 0.23cd | 1.67d | 2.62h | 0.22g | 4.53b | 19.62eghi |
| TSP4 | 1.77g | 2.17c | 0.23e | 0.27f | 2.13j | 2.49ef | 0.187ef | 5.84c | 18.82ef |
| TSP5 | 1.96i | 2.12b | 0.22d | 0.24d | 1.54d | 3.29k | 0.17abcd | 3.23a | 18.88ef |
| TSP6 | 1.96i | 2.52h | 0.24e | 0.29g | 1.55b | 2.74j | 0.18def | 7.15d | 19.46efg |
| Mean | 1.608 | 2.265 | 0.247 | 0.247 | 1.669 | 2.324 | 0.198 | 6.789 | 18.597 |
| P Value | 0.001 | 0.001 | 0.001 | 0.001 | 0.001 | 0.001 | 0.001 | 0.001 | 0.001 |
| CV (%) | 2 | 1.91 | 6.1 | 5.8 | 1.5 | 1.75 | 6.9 | 4.9 | 2.4 |
| SEM (±) | 0.01 | 0.011 | 0.003 | 0.004 | 0.006 | 0.018 | 0.006 | 0.178 | 0.288 |
Table 2: Nutrient concentration in maize plants at Ilakala site; DAP is Di Ammonium Phosphate, MM is MINJINGU MAZAO and TSP is Triple Super Phosphate; fertilizer rates numbered 1 to 6 are control (farmers not applying fertilizer), 10 and 5, 20 and 10, 40 and 20, 60 and 30, 80 and 40 kg N/ha and P/ha, respectively. Numbers in columns followed by same letter(s) do not differ significantly at P= 0.05 according to Tukey’s test.
Nutrient concentrations at Changarawe study site were significantly affected by fertilizer types and rates as shown in Table 3. Nitrogen increased from control to fertilizer rates and reached a maximum at micro-dose rates in DAP, recommended rate in MM and intermediate rate in TSP during 2015 and 2016. Phosphorus increased from control to different fertilizer rates and reached maximum at recommended rate during 2015 while 2016 the maximum P was at micro-dose and intermediate rates. Potassium concentration increased from control to different fertilizer rates with a maximum K at micro-dose, intermediate and recommended rates inconsistently during 2015 and 2016. Concentration of sulphur increased with fertilizer rates from different fertilizer types with a maximum at TSP4 during 2016. Concentration of zinc was not consistent and was decreasing with increased fertilizer rate and for the second year the concentration was very low compared to the first year.
| Treatment | N (%) 2015 | N (%) 2016 | P (%) 2015 | P (%) 2016 | K (%) 2015 | K (%) 2016 | S (%) 2016 | Zn (ppm) 2015 | Zn (ppm) 2016 |
|---|---|---|---|---|---|---|---|---|---|
| DAP1 | 1.91a | 1.46b | 0.09a | 0.10a | 3.73bcd | 2.54cd | 0.11a | 51.18m | 38.13e |
| DAP2 | 2.07c | 1.52c | 0.10bc | 0.11b | 3.94de | 2.84h | 0.21cde | 37.42e | 32.68cde |
| DAP3 | 2.33h | 1.95h | 0.11def | 0.12bc | 3.40b | 2.85h | 0.23f | 30.84b | 28.46abcd |
| DAP4 | 2.17f | 1.88g | 0.10bc | 0.12bc | 3.86cde | 3.37j | 0.20cd | 2234a | 34.80de |
| DAP5 | 1.96b | 1.88g | 0.10bc | 0.20hi | 3.55bc | 2.62ef | 0.21cde | 33.08d | 23.50abc |
| DAP6 | 2.14ef | 1.70d | 0.12fg | 0.19fg | 4.68g | 2.62ef | 0.14b | 32.36c | 24.33abc |
| MM1 | 1.91a | 1.51c | 0.09a | 0.10a | 3.73bcd | 2.54cd | 0.11a | 51.18m | 38.13e |
| MM2 | 2.13de | 1.80f | 0.11def | 0.13cd | 4.15ef | 2.66fg | 0.23f | 53.51n | 20.67a |
| MM3 | 2.09cd | 1.74e | 0.12fg | 0.18f | 3.02a | 2.64ef | 0.22def | 42.02f | 30.59bcde |
| MM4 | 2.58j | 1.53c | 0.12fg | 0.13cd | 5.46h | 2.34a | 0.22def | 47.43j | 26.11abcd |
| MM5 | 2.25g | 1.67d | 0.10bc | 0.20hi | 4.32f | 2.62ef | 0.20c | 42.73g | 21.70ab |
| MM6 | 2.77k | 2.03i | 0.13h | 0.16e | 5.25h | 3.12i | 0.22def | 50.31l | 26.57abcd |
| TSP1 | 1.90a | 1.49bc | 0.09a | 0.10a | 3.74bcd | 2.47bc | 0.11a | 50.55lm | 37.55e |
| TSP2 | 2.44i | 1.37a | 0.11def | 0.19fg | 5.47h | 2.58de | 0.22def | 55.84o | 23.30ab |
| TSP3 | 2.34h | 1.78f | 0.10bc | 0.19fg | 4.83g | 2.54cd | 0.22def | 47.27j | 38.26e |
| TSP4 | 2.44i | 1.67d | 0.10bc | 0.14d | 4.11ef | 2.46b | 0.27h | 44.94h | 34.80de |
| TSP5 | 2.55j | 1.88g | 0.12fg | 0.21i | 3.96de | 2.54cd | 0.25g | 48.17k | 21.54a |
| TSP6 | 2.35h | 1.81f | 0.12fg | 0.19fg | 4.05def | 2.72g | 0.21cde | 46.25i | 25.60abc |
| Mean | 2.24 | 1.71 | 0.11 | 0.15 | 4.18 | 2.67 | 0.2 | 43.75 | 28.53 |
| P Value | 0.001 | 0.001 | 0.001 | 0.001 | 0.001 | 0.001 | 0.001 | 0.001 | 0.079 |
| CV (%) | 6 | 7.8 | 18.4 | 13.4 | 5.1 | 6.1 | 9.8 | 6.6 | 19.4 |
| SEM (±) | 0.013 | 0.012 | 0.003 | 0.005 | 0.122 | 0.022 | 0.005 | 0.218 | 3.149 |
Table 3: Nutrient concentration in maize plants at Changarawe site; DAP is Di Ammonium Phosphate, MM is MINJINGU MAZAO and TSP is Triple Super Phosphate; fertilizer rates numbered 1 to 6 are control (farmers not applying fertilizer), 10 and 5, 20 and 10, 40 and 20, 60 and 30, 80 and 40 kg N/ha and P/ha, respectively. Numbers in columns followed by same letter(s) do not differ significantly at P= 0.05 according to Tukey’s test
Phosphorus uptake at Ilakala and Changarawe was affected by fertilizer type, fertilizer rate and cropping season as shown in Figure 2. Ilakala had higher P uptake than Changarawe in all treatments. The nutrient uptake was 3 to 29 kg P/ha and 1 to 5.4 kg P/ha in the first year while in the second year the range was 16 to 37 kg P/ha and 1 to 5.3 kg P/ha at Ilakala and Changarawe respectively. At Ilakala, control had the lowest uptake in both cropping seasons, the first year had low P uptake in all fertilizer types and rates compared to the second year. Phosphorus uptake from DAP increased up to DAP5 (30 kg P/ha) during 2015 and DAP3 (10 kg P/ha) during 2016, and thereafter decreased. The P uptake in MM and TSP increased with increasing fertilizer rates up to the recommended 40 kg P/ha during 2015 while during the second year the trend decreased after MM3 and TSP4. At Changarawe, control plot had the lowest uptake in both cropping seasons. The second year had the lowest P uptake in all fertilizer types and rates compared to the first year. The P uptake increased with increasing fertilizer rate from 0 to 40 kg P/ha.
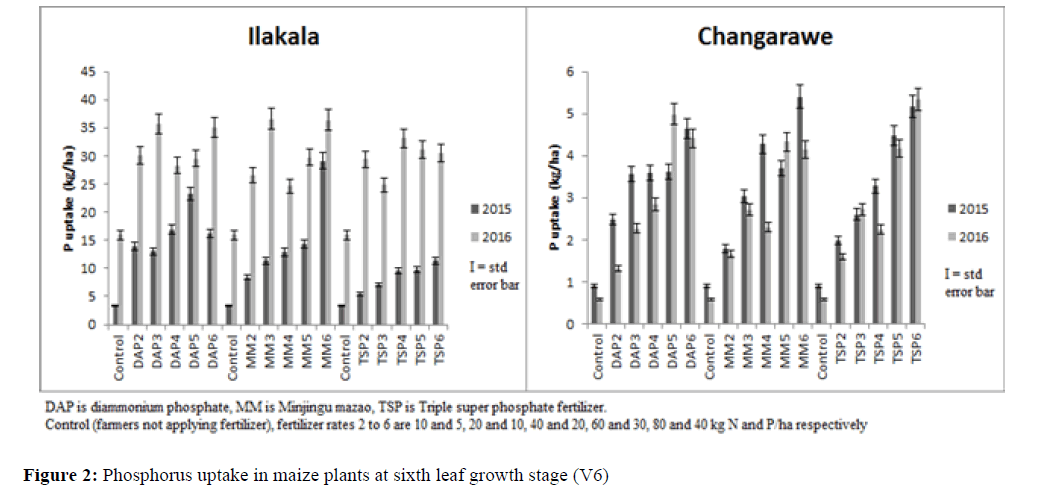
Figure 2:Phosphorus uptake in maize plants at sixth leaf growth stage (V6).
Effects of fertilizer type and rates on crop growth
The effect of fertilizer type and micro-dose rates on leaf area index (LAI) is shown in Figure 3. Fertilizer application significantly improved LAI compared to the control (P=0.001) at sixth leaf growth stage (V6) and silking growth stage (R1). No significant increase in LAI at R1 and dough growth stage (R4) was found after addition of DAP4 and TSP4 (40 kg N and 20 kg P/ha). However, addition of MM3 (20 kg N and 10 kg P/ha) improved LAI similar to MM4 (40 kg N and 20 kg P/ha) and MM5 (60 kg N and 30 kg P/ha). At V6 growth stage, LAI was very low about 0.56 in control while the highest was 1.43 in Minjingu mazao fertilizer at the recommended rate (80 kg N and 40 kg P/ha). At R1 growth stage, the lowest LAI was 2.2 in control plots while the highest value was 4.1 in MM6. At R4 growth stage, the lowest LAI was 1.58 in control plots while the highest was 3.44 in DAP5. LAI was low at V6 and reached maximum at R1 and decreased slightly at R4.
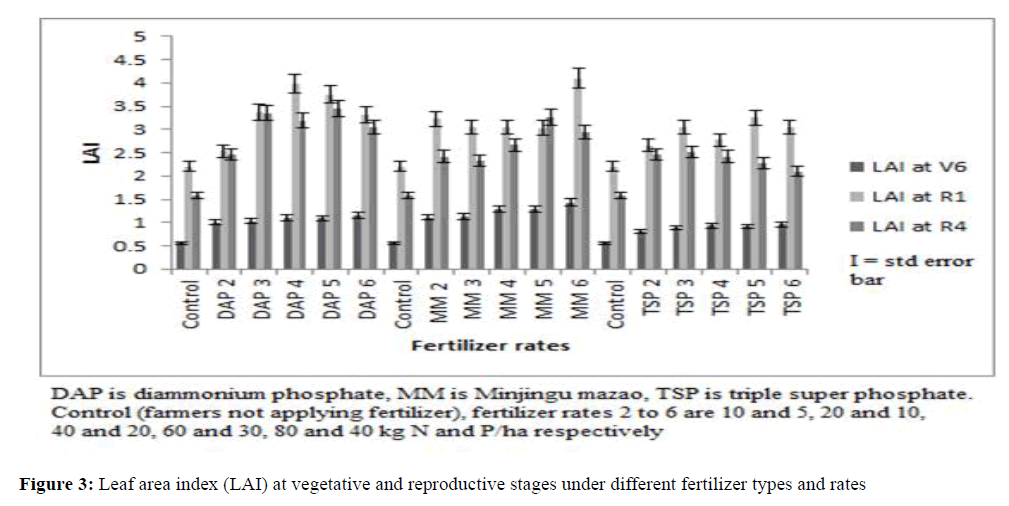
Figure 3:Leaf area index (LAI) at vegetative and reproductive stages under different fertilizer types and rates.
Crop growth rate (CGR) under different fertilizer types and micro-dose rates is shown in Figure 4. Between sixth leaf growths stage (V6) and silking (R1) the rate of growth was generally low about 14.7 in control plot and very high 33.8 g m-2 day-1 in di-ammonium phosphate fertilizer at recommended rate (DAP6). While between silking (R1) and dough stage (R4), the rate of crop growth was increasing at decreasing rate of 4.7 in control plots while in micro-dose fertilizer rates the CGR increased up to 55.6 g m-2 day-1 in DAP6. Generally, CGR increased in all plots except control at reproductive growth stages which decreased rapidly by -4.7 g m-2 day-1.
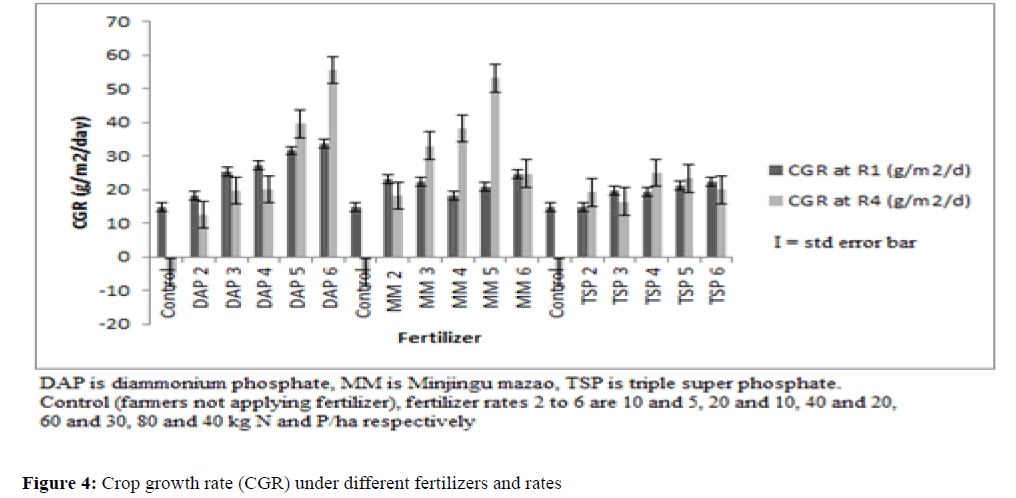
Figure 4:Crop growth rate (CGR) under different fertilizers and rates.
Effect of fertilizers on yield components, grain and total dry matter
The influence of fertilizer types and rates on yield components and yield at Ilakala site is shown in Table 4. In 2015 number of grains, 100 grain weight and grain yield were significantly higher in MM than DAP and TSP. Plant population at harvest was between 3.84 and 3.99 in 2015 while 2016 was between 3.9 and 4.1 plants m-2. The number of grains were significantly higher in MM (P=0.003) than DAP and TSP fertilizers during 2015. Also, fertilizer rates had highly significant number of grains (P=0.001) which increased from control to micro-doses and decreased slightly towards 6 (recommended rate). The weight of hundred grains was highly significant in fertilizer rates (P=0.001) and increased with fertilizer application. Grain yield was highly significant in fertilizer types and rates (P ≤ 0.01), the yield increased significantly with fertilizer application from control to rates three (3) and four (4) and depended on season. Biological yields increased with fertilizer rates up to rate 5 and 6 (Table 4).
| Treatment | 2015 | 2016 | ||||||||
|---|---|---|---|---|---|---|---|---|---|---|
| Plant (# m-2) | Grains (# m-2) | 100 Grain wt (g) | Grain yield (kg/ha) | TDM at harvest (g-2) | Plant (# m-2) | Grains (# m-2) | 100 Grain wt (g) | Grain yield (kg/ha) | TDM at harvest (g-2) | |
| Fertilizer | ||||||||||
| DAP | 3.83a | 679.1a | 34.69a | 2373a | 511.3ab | 4.05a | 1584a | 32.59a | 2596a | 827.2a |
| MM | 4.03a | 754.5b | 35.51a | 2707b | 539.9 b | 4.16b | 1580a | 33.01a | 2635a | 841.4a |
| TSP | 3.86a | 680.2a | 35.00a | 2396a | 488.1 a | 3.98a | 1671a | 33.58a | 2721b | 846.1a |
| Mean | 3.91 | 704.6 | 35.07 | 2492 | 513.1 | 4.06 | 1612 | 33.06 | 2651 | 838 |
| CV (%) | 3.4 | 3.12 | 5.92 | 3 | 1.9 | 0.43 | 19.5 | 6.9 | 1.2 | 16.7 |
| SEM | 0.05 | 16.91 | 0.74 | 2.2 | 14.38 | 0.028 | 74 | 0.539 | 1.52 | 32.9 |
| P value | 0.06 | 0.003 | 0.731 | 0.001 | 0.003 | 0.025 | 0.622 | 0.436 | 0.01 | 0.915 |
| Rates | ||||||||||
| 1 | 3.99 a | 409.1a | 28.20a | 1152a | 313.0 a | 4.12a | 992a | 29.3a | 1492a | 496.8a |
| 2 | 3.89a | 586.1b | 35.42b | 2064b | 424.8 b | 4.03a | 1470b | 33.07b | 2394b | 855.0b |
| 3 | 3.90a | 775.7c | 37.62b | 2888c | 578.9 c | 4.01a | 1782b | 33.12b | 2590c | 841.8b |
| 4 | 3.84a | 829.3c | 35.87b | 2930c | 587.2 c | 3.99a | 1798b | 34.24b | 2938d | 900.2b |
| 5 | 3.93a | 803.3c | 36.90b | 2938c | 596.1 c | 4.08a | 1840b | 34.25b | 3229e | 953.2b |
| 6 | 3.92a | 824.0c | 36.38b | 2980c | 578.5 c | 4.07a | 1787b | 34.40b | 3264e | 982.6b |
| Mean | 3.91 | 704.6 | 35.07 | 2492 | 513.1 | 4.06 | 1612 | 33.06 | 2651 | 838 |
| CV (%) | 2.6 | 3.12 | 5.92 | 3.8 | 1.9 | 1.4 | 19.5 | 6.9 | 1.1 | 16.7 |
| SEM | 0.048 | 23.91 | 1.04 | 3.12 | 20.24 | 0.042 | 104.6 | 0.763 | 2.02 | 46.6 |
| P value | 0.38 | 0.001 | 0.001 | 0.001 | 0.001 | 0.429 | 0.001 | 0.001 | 0.001 | 0.001 |
Table 4: Effects of fertilizer types and rates on yield components and yields at Ilakala site; where: 1=0 and 0, 2=10 and 5, 3=20 and 10, 4=40 and 20, 5=60 and 30 and 6=80 and 40 kg N and P/ha respectively. Numbers in columns followed by same letter(s) do not differ significantly at P= 0.05 according to Tukey’s test
At Changarawe site, effects of fertilizer types and rates on yield components and yield are shown in Table 5. In 2015, the number of grains and grain yields were significantly higher in MM than DAP and TSP. The number of plant at harvest was between 3.8 and 4.02 plants m-2. The number of grains increased significantly in fertilizer types and rates (P=0.001) during 2015 and 2016 at P=0.019 and 0.001 for fertilizer types and rates respectively. The weight of hundred grains was highly significant in fertilizer rates (P=0.001) with the lowest weight in rate 1. Grain yield was highly significant in fertilizer types and rates (P ≤ 0.01) in both cropping seasons. The grain yields increased with fertilizer rates up to intermediate rates (4 and 5) and decreased at recommended rate (Table 5). The yield increase was highly influenced by seasons where higher yields averaged 2572 kg/ha during 2015 while during 2016 yields were low averaging 1089 kg/ha. Biological yields increased with fertilizer rates to two folds in rates 5 and 6.
| Treatment | 2015 | 2016 | ||||||||
|---|---|---|---|---|---|---|---|---|---|---|
| Plant (#m-2) | Grains (#m-2) | 100 Grain wt (g) | Grain yield (kg/ha) | TDM at harvest (g-2) | Plant (#m-2) | Grains (#m-2) | 100 Grain wt (g) | Grain yield (kg/ha) | TDM at harvest (g-2) | |
| Fertilizer (a) | ||||||||||
| DAP | 3.86a | 853.7b | 30.33a | 2615b | 859.4a | 3.95ab | 378.3b | 29.15a | 1107b | 813.8b |
| MM | 4.03b | 946.2c | 29.41a | 2819c | 897.6a | 3.99b | 366.0ab | 29.80a | 1105b | 625.8a |
| TSP | 3.89a | 745.7a | 30.16a | 2287a | 861.0a | 3.89a | 349.9a | 29.75a | 1056a | 628.9a |
| Mean | 3.924 | 849 | 29.97 | 2572 | 872.7 | 3.95 | 364.7 | 29.57 | 1089.3 | 689.5 |
| CV (%) | 2.9 | 6.6 | 1.4 | 6.6 | 2.5 | 2.1 | 3.6 | 2.2 | 3.6 | 10.3 |
| SEM | 0.03 | 29.1 | 0.812 | 9.17 | 21.44 | 0.024 | 4.01 | 0.231 | 0.752 | 12.92 |
| P value | 0.001 | 0.001 | 0.485 | 0.01 | 0.147 | 0.018 | 0.019 | 0.199 | 0.005 | 0.001 |
| Rates (b) | ||||||||||
| 1 | 3.86a | 352.5a | 24.84a | 874a | 512.9a | 3.90a | 218.8a | 24.55a | 530a | 454.0a |
| 2 | 3.96a | 729.0b | 30.71b | 2215b | 717.8b | 3.95a | 376.4b | 27.97b | 1037b | 601.8b |
| 3 | 3.91a | 957.5c | 31.67b | 3023cd | 879.1c | 3.89a | 354.3b | 30.48c | 1076bc | 662.0b |
| 4 | 3.88a | 1095.7d | 30.65b | 3309d | 1000.8d | 3.98a | 433.1c | 31.04c | 1336d | 808.0c |
| 5 | 3.96a | 988.9cd | 30.55b | 2992c | 1067.7d | 4.02a | 441.9c | 32.36d | 1428e | 792.4c |
| 6 | 3.99a | 967.7c | 31.39b | 3029cd | 1057.6d | 3.94a | 364.0b | 31.01c | 1130c | 818.9c |
| Mean | 3.92 | 849 | 29.97 | 2572 | 872.7 | 3.95 | 364.7 | 29.57 | 1089.3 | 689.5 |
| CV (%) | 1.7 | 6.6 | 1.4 | 8 | 2.5 | 1.7 | 2.5 | 1.7 | 1.5 | 10.3 |
| SEM | 0.034 | 41.1 | 1.148 | 6.47 | 30.32 | 0.034 | 8.84 | 0.279 | 1.736 | 18.27 |
| P value | 0.065 | 0.001 | 0.001 | 0.001 | 0.001 | 0.088 | 0.001 | 0.001 | 0.001 | 0.001 |
Table 5: Effects of fertilizer types and rates on maize yield components and yields at Changarawe; Where: 1=0 and 0, 2=10 and 5, 3=20 and 10, 4=40 and 20, 5=60 and 30, and 6=80 and 40 kg N and P/ha, respectively. Numbers in columns followed by same letter(s) do not differ significantly at P= 0.05 according to Tukey’s test
Interaction effects of fertilizer types and rates on grain yield
The interaction effect between fertilizer types and rates was highly significant (P=0.001) in grain yield in both first and second year (Figure 5). There was a positive increase from control to fertilizer rate 4 and 5 in DAP, MM and TSP fertilizer and thereafter yield decreased towards recommended rate in Ilakala and Changarawe. Similar trend was observed during the second cropping season in both villages (Figure 5).
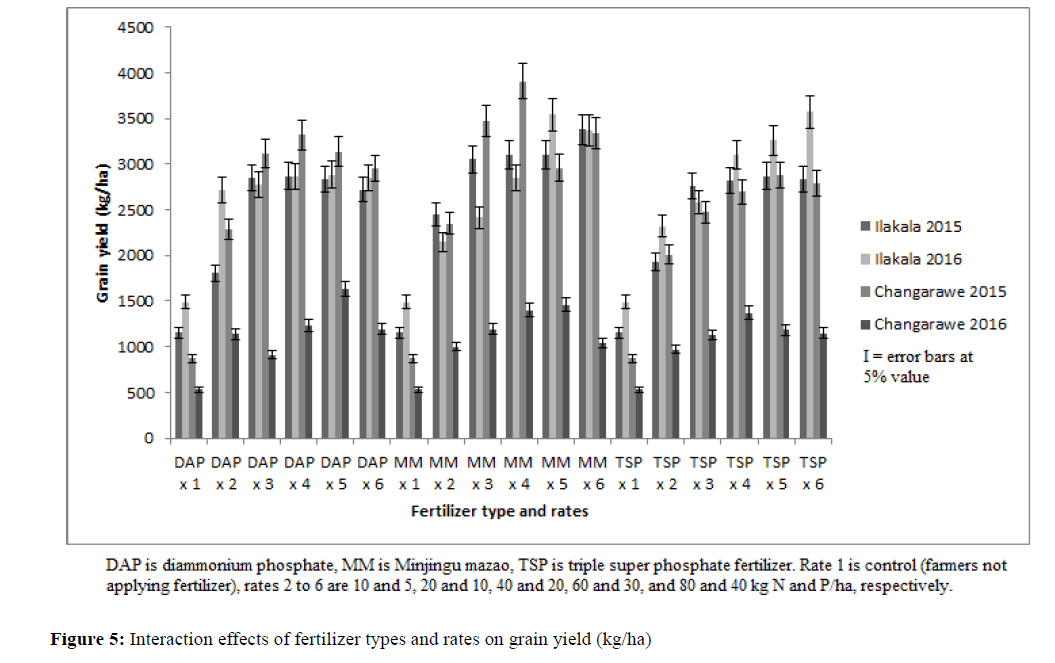
Figure 5:Interaction effects of fertilizer types and rates on grain yield (kg/ha).
The results indicated a high effect of the fertilizer rates on grain yield in both seasons and at both sites as presented in Figure 6. The R2 values were 0.96 and 0.97 at Ilakala and 0.94 and 0.92 at Changarawe for the 2015 and 2016 seasons respectively.
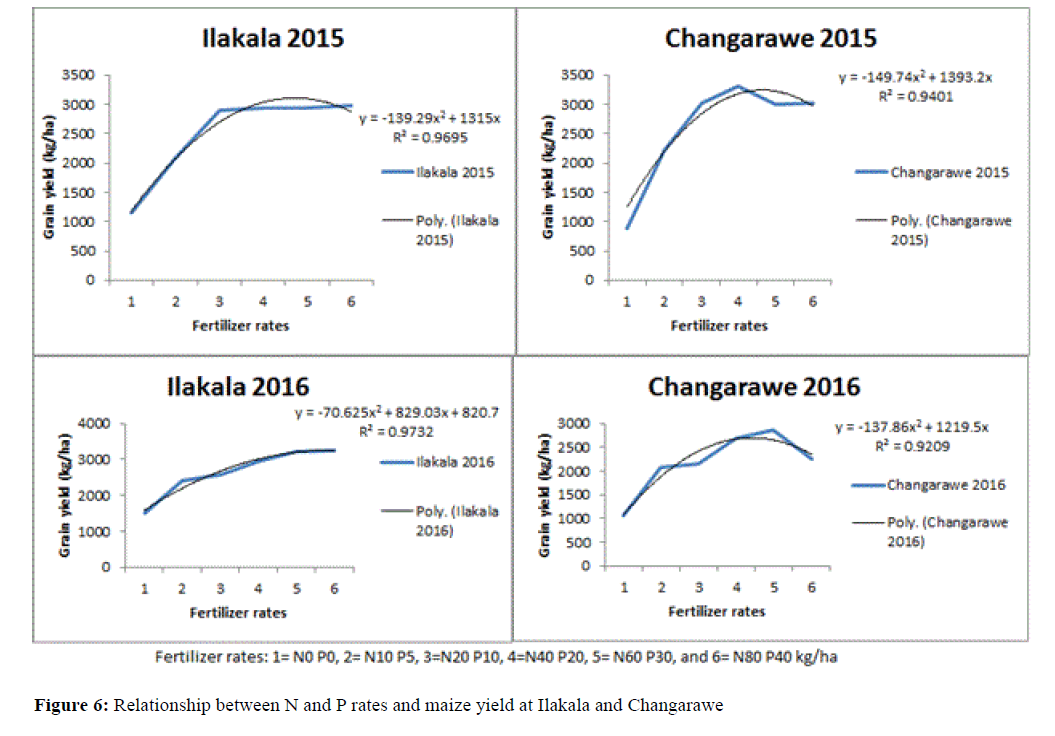
Figure 6:Relationship between N and P rates and maize yield at Ilakala and Changarawe.
Agronomic effectiveness of fertilizers used
Relative agronomic effectiveness (RAE) of Minjingu Mazao (MM) fertilizer against DAP and TSP as standard fertilizers is shown in Table 6. At Ilakala site, during 2015 cropping season RAE of MM was 36.5% and 29.4% above the standard fertilizers DAP and TSP respectively. During 2016 cropping season, RAE for MM as a test fertilizer was 2% above DAP and 9.14% below the TSP as standard fertilizer. At Changarawe site, RAE in MM during 2015 was 11.10% and 38.5% above the standard fertilizers DAP and TSP respectively while during 2016 RAE was 7.2% and 9.2% above the standard fertilizers DAP and TSP, respectively.
| Fertilizer type | Ilakala | Changarawe | ||
|---|---|---|---|---|
| RAE (%) 2015 | RAE (%) 2016 | RAE (%) 2015 | RAE (%) 2016 | |
| DAP | 100 | 100 | 100 | 100 |
| MM | 136.5 | 102 | 111.1 | 107.2 |
| CV (%) | 27.14 | 40.05 | 11.53 | 38.6 |
| SEM | 16.57 | 18.27 | 5.73 | 18.5 |
| TSP | 100 | 100 | 100 | 100 |
| MM | 129.4 | 90.86 | 138.5 | 109.2 |
| CV (%) | 16.69 | 16.17 | 18.87 | 19.44 |
| SEM | 9.66 | 6.67 | 11.68 | 9.5 |
Table 6: Relative agronomic effectiveness (RAE) of Minjingu Mazao against DAP and TSP fertilizers; Data were subjected to descriptive statistics
Soil characteristics and weather condition
Soils at Ilakala site were characterized by sandy loam and sandy clay with a neutral pH that was within the range suitable by most crops [34]. Soils were characterized by low nitrogen mainly due to nature of the soil that is highly weathered and leached as reported by Szilas et al. [35]. Medium soil phosphorus levels was probably due to the medium soil pH which was between 6 and 7.5 which was ideal for P availability as reported by Landon [34] and Foth et al. [36]. Zinc was below a critical level of 1 mg/kg required for crop production according to Landon [34] caused by Zn-P antagonism and soil pH in Ilakala [34,36].
In Changarawe, soils texture was sandy clay loam and sandy loam with strongly acidic soil reaction due to leaching of basic cations caused by high rains in the area as observed by Foth et al. [36]. Nitrogen and phosphorus were very low mainly due to highly weathered and leached soils. Low pH values (<5.5) in soils probably reduced bacterial activities and nitrification of organic matter contributing to low N as reported by Prasad et al. [24] and Landon [34], also phosphate ions probably combined with iron and aluminium to form P-compounds not readily available [34]. Low zinc in the soil below a critical level of 1 mg/kg required for crop production was due to highly weathered acidic soil in Changarawe [34]. These findings are in agreement with that also worked in the same agro-ecological zone [17].
Variations in rainfall amount and distribution between Ilakala and Changarawe during the seasons are due to their distance from each other and differences in geographical locations. Ilakala site is hilly and surrounded by mountains and characterized by high vegetation cover such as forests contrary to Changarawe. There was a change in rainfall pattern between the two cropping seasons characterized by unexpected onset and erratic as previously reported in Manyoni, Tanzania [37] and Accra, Ghana [38]. This inter-seasonal and intra-seasonal variation of rainfall could have been influenced by the impact of climate change [39].
Nutrient concentration in maize crop
The deficiency of N during 2015 and 2016 (Tables 2 and 3) was reflecting poor soil fertility (Table 1). However, soil N was improved by fertilizer application. N concentration improved to sufficient range during 2016 at Ilakala and during 2015 at Changarawe due to good rainfall pattern from seedling to sixth leaf growth stage indicating that availability and uptake was affected by soil moisture [29]. Hochmuth et al. [28] reported that soil N levels of 3-4% are adequate for maize production. Nitrogen concentration increased from control to fertilizer application in similar trend reported by Maurice et al. [40].
Phosphorus was within adequate range of 0.3-0.5% reported by Hochmuth et al. [28] in most fertilizer treatments (Table 2) for both cropping years due to fertilizer application in the soil with soil pH that was in the range ideal for P availability and uptake by plants as reported by Landon [34] and Foth et al. [36]. However, at Changarawe site P was deficient in plants (Table 3) reflecting poor soil fertility status (Table 1). Also, excessive precipitation in 2016 February increased nutrient loss and reduced nutrient uptake due to poor aeration and death of root hairs [29].
Potassium was deficient in 2015 while 2016 the concentration increased to adequate range in Ilakala (Table 2) while in Changarawe K was adequate (Table 3) reflected in soil fertility (Table 1) possibly due to the effect of other nutrients such as nitrogen and phosphorus concentration as well as precipitation during early vegetative stage (V1- V6) which promoted root growth and expansion for nutrient absorption from the soil which had adequate potassium [29]. Hochmuth et al. [28] reported that concentration of 2.5-4% K is adequate for optimum maize production. Concentration of sulphur was deficient (<0.4%) in all treatments at Ilakala (Table 2) and Changarawe (Table 3). However, N to S ratio was below 18:1 indicating that S was in the range suitable for protein development. Zinc was deficient in plants at Ilakala (Table 2) while at Changarawe (Table 3) Zn was adequate (30-40 ppm) in both cropping years due to increasing acidity in the soil as reported by Landon et al. [34].
The phosphorus (P) uptake in maize plant at Ilakala was higher than Changarawe site because the experimental site at Ilakala had medium P while Changarawe had very low P in the soil. The results of P uptake in this study at Ilakala site are in the range reported by Muhawish et al. [33] 24 to 45 kg P/ha in slightly alkaline soils with medium P. At Ilakala, P uptake was higher at micro-dose rates (10, 20 and 30 kg P/ha) than at recommended rate (40 kg P/ha) due to medium soil P which probably needed only small rates for maximum P uptake unlike the soil with low P status.
The trend of P uptake at Ilakala was higher in the second year 2016 than first year 2015 due to high amount and good distribution of rainfall between seedling and sixth leaf growth stages in second year unlike the first year which was characterized by prolonged dry spell (Figure 1) which affected nutrient uptake. The opposite was true for Changarawe which had higher nutrient uptake in the first year 2015 than the second year, probably caused by a dry spell from third week to sixth week after planting (Figure 1) which coincided with seedling and sixth leaf growth stage and affected nutrient uptake due to moisture stress as observed by Fageria et al. [29]. Therefore, nutrient uptake especially P was highly affected by moisture stress in the soil, initial soil P as well as P fertilizer sources and rates.
Crop growth, yield and yield components
As expected LAI was low (1.43) at sixth leaf growth stage but increased to maximum (4.1) at silking growth stage and thereafter decreased gradually to 3.44 at dough growth stage (Figure 3). Such results are documented by Portes et al. [41]. LAI was the lowest in control plots; this reflects the importance of applying fertilizer which supplies nitrogen in the soil with low fertility status (Table 1) for crop growth and development as stated by Fageria et al. [29]. The reports by Fageria et al. [29] and Nguya-Robertson et al. [42] indicate that optimum LAI is between 3 and 5. Some plots treated with fertilizer had LAI below the optimum (<3), such results could be due to dry spell at boot (V13), tasseling (VT) and silking (R1) growth stages (Figure 1).
Crop growth rate (CGR) increased from sixth leaf growth stage (V6) to silking (R1) following the same trend as LAI due to increased photosynthesis which is influenced by leaf surface area. The increasing trend of LAI (Figure 3) resulted into more dry matter accumulation and crop growth rate (Figure 4) as significant positively correlated (r=0.94*) by Portes et al. [41]. Such results were also reported by Sani et al. [43] ranging between 11 and 16.7 g m-2 day-1 in Nigeria and between 28 and 41 g m-2 day-1 at tasseling [44]. In control treatment the rate of growth was decreasing from silking (R1) to dough stage (R4) due to loss of leaves and decreased photosynthetic activity as reported by Hokmalipour et al. [45].
Fertilizer types and rates applied resulted into increase in total dry matter (TDM) production averaging 5.13-8.72 T/Ha such results have also been reported by Kisetu et al. [46] and also working in Morogoro region. The results show that even under unreliable rainfall conditions farmers could still get TDM for livestock feed and other uses as observed by De Groote et al. [47] in Tanzania and in West Africa. Grain yield at both sites indicate that Minjingu Mazao (MM) was the best fertilizer for use under farmers condition. The MM fertilizer produced on average 2317 kg/ha which was 6.6% and 9.6% more than DAP and TSP, respectively. This could be due to multiple nutrient content and ability to supply both macro-nutrients (N, P, Mg, S, Ca) and micro-nutrients (B, Zn) which improved nutrient concentration in plants (Tables 2 and 3), nutrient uptake (Figure 2) and LAI (Figure 3) [22]. Fertilizer microdose rates at 2 (10 kg N and 5 kg P/ha) and 3 (20 kg N/ha and 10 kg P/ha) increased yield by 912-1736, 902-1098 kg/ha in Ilakala; 1341-2149, 507-546 kg/ha in Changarawe during 2015 and 2016 cropping seasons, respectively. The trend of yield increase reported in this study is similar to that observed by Amuri et al. [17] and Mourice et al. [40]. However, at Changarawe village during 2016 results were highly affected by drought from 3rd to 9th week after planting (Figure 1). Fertilizer rates (40 kg N and 20 kg P/ha) and (60 kg N and 30 kg P/ha) performed almost the same as recommended rate. Our study was carried out in only two locations; however, we consider the sites highly representative for large sub-humid tropical regions with sandy loam and sandy clay soils typical for this agroecological zone [48].
Fertilizer affordability by smallholder farmers
Thus it is suggested that the reported rates 50% and 75% from this study be recommended to replace the current recommendation of 80 kg N and 40 kg P /ha for the eastern zone including Kilosa in these areas Marundu et al. [4]. Further, the current results from micro dosing rates of N and P are in agreement with rates suggested by Semoka (Personal Communication). In most Agro shops found in Tanzania, MM is sold at Tsh 35,000-40,000/=per bag of 50 kg while DAP and TSP are sold at 60,000-90,000/=per 50 kg bag. The relative agronomic effectiveness (RAE) indicated that Minjingu Mazao (MM) fertilizer had RAE more than 100% (Table 6), suggesting that MM was superior to DAP and TSP used as a standard fertilizers used in this study. Therefore, MM fertilizer is an affordable source of P with higher RAE. This result is in agreement with Muhawish & Razaq [33] who reported that phosphate rock fertilizers with low and medium P solubility had higher RAE (113%<) than higher solubility fertilizers such as TSP.
The results reported on grain in this study are slightly higher than those reported by DTMA [49] and other researchers who have worked under Tanzania’s farmers’ field conditions. Such results could have been contributed by relatively large grain size reported in this study that ranged from 29.57 to 35.07 g/100 grains. The grain weight reported in this study was also found to be significantly correlated to grain yield (r=0.913* to 0.964**).
Minjingu Mazao fertilizer performed better than DAP and TSP in this study. Micro-dosing fertilizer increased yield by 90.5% and 136.56% at 10 kg N and 5 kg P/ha (12.5% of recommended rate) and 20 kg N and 10 kg P/ha (25% of recommended rate) than control, respectively. Intermediate fertilizer rates produced more grain yield by 1.0% and 1.1% at 40 kg N and 20 kg P/ha (50% of recommended rate) and 60 kg N and 30 kg P/ha (75% of recommended rate) compared to recommended rate (80 kg N and 40 kg P/ha), respectively.
A combination of fertilizer rates of 10 kg N and 5 kg P ha-1 (12.5% of recommended rate) as well as 20 kg N and 10 kg P ha-1 (25% of recommended rate) are the appropriate micro-dose fertilizer rates for maize production in the study site and other areas with similar conditions. The fertilizer micro-doses recommended from this study will improve crop productivity under smallholder farming systems in sub-humid tropical regions. Also, intermediate rates of 40 kg N and 20 kg P ha-1 (50% of recommended rate) as well as 60 kg N and 30 kg P ha-1 (75% of recommended rate) are recommended to replace 80 kg N and 40 kg P/ha for resource endowed farmers who can afford higher application rates. Also, fertilizer package has to include lower amount such as 5, 10, 20 and 25 kg bag to accommodate microdose strategy and affordability to resource poor farmers who can rarely afford to buy a 50 kg bag package. It is important to avail locally produced cheap fertilizers if they have a lower market price and good agronomic effectiveness.
This work is a product of the Trans SEC project for food security in Africa, funded by the Germany Federal Ministry of Education and Research (BMBF) and the Germany Federal Ministry for Economic Cooperation and Development (BMZ).