Research Article - European Journal of Sports & Exercise Science ( 2018) Volume 6, Issue 1
Post-exercise leucocytosis has been found in children and adults in response to exercise. When normalized to the work performed, children demonstrate a lower lactate response to exercise than in adults. This study examines the association between leukocyte and lactate response in children following exercise. 148 healthy children participated in this study. Each subject performed a ramp exercise on a cycle ergometer followed by ten 2-minute bouts of constant work rate separated by 1-minute rest intervals. Lactate, leukocyte and leukocyte subtype levels were taken pre- and post-exercise. Older children showed a significantly higher pre-to post-exercise leukocyte compared to younger children (3599 ± 165 cells/mL, 2544 ± 163, p<0.0001). Compared to older children, younger children demonstrated a smaller median fold change in lactate (2.7 (1.4-8.1), 4.1 (1.7-29.6)) and leukocyte levels (1.4 (1.0-2.1), 1.6 (1.2-2.8)) after exercise, with a larger leukocyte to lactate fold change ratio.
Exercise, Paediatrics, Inflammation, Leukocyte, Lactate
It is becoming increasingly recognized that even brief exercise can substantially influence the distribution of white blood cells within the circulation and marginal pools [1,2]. The response of immune cells to physical activity is of growing interest because some key health effects of exercise, both beneficial and detrimental, may well be mediated through the activity of circulating leukocytes [3].
Growth in humans is a dynamic process regulated through the interplay of anabolic and catabolic hormones and cytokines. What is particularly intriguing is that many of these mediators in children, such as growth mediators and their antagonist (often inflammatory mediators), also appear to play substantial roles in the adaptive responses to physical activity [4,5]. A potential link between inflammatory mediators and exercise may be related to the availability of oxygen to the tissues. When normalized to the amount of work performed, muscle oxygen uptake is greater and blood lactate concentration is lower in children compared to adults. Lactate level in response to exercise reflects the degree of tissue stress, predominantly related to insufficient oxygen transport [6].
The adaptive effects of exercise-induced inflammation have been well studied in adults but less so in children. There has been scant data on the inflammatory response to exercise in children in the literature. These previous studies are limited by small sample sizes and evaluate either sex or age differences alone. Our larger study evaluates relationships between leucocytosis and lactate concentrations following exercise characterized by BMI, age and sex-related differences. We hypothesized that following exercise, the lower lactate levels in younger children would be associated with similarly lower leukocyte levels as compared to older children, and that both responses would be modulated by sex and BMI.
Participants
148 healthy children ages eight to eighteen years old participated in this study. Table 1 illustrates the anthropometric and physiologic characteristics of the participants. Individuals engaged in competitive sports or with history of chronic medical conditions or use of any medications were excluded from participation. The study was approved by the Institutional Review Board at the University of California, Irvine and written informed assent and consent was obtained from all participants and their parents upon enrolment.
| Girls | Boys | ||||||||
|---|---|---|---|---|---|---|---|---|---|
| Age | 8-12 | 13-18 | 8-12 | 13-18 | |||||
| BMI %tile | <85 | = 8 5 | <85 | = 85 | <85 | = 85 | <85 | = 85 | |
| N | 26 | 17 | 21 | 15 | 15 | 17 | 20 | 17 | |
| Height (cm) | 141.5 ± 10.9 | 147.5 ± 10.8 | 163.2 ± 5.4 | 162.7 ± 7.0 | 142.6 ± 10.1 | 149.8 ± 10.4 | 176.1 ± 7.4 | 176.1 ± 7.6 | |
| Weight (kg) | 34.5 ± 9.9 | 57.3 ± 17.7 | 57.0 ± 6.1 | 91.9 ± 29.0 | 34.9 ± 6.6 | 59.5 ± 16.6 | 65.0 ± 9.6 | 96.4 ± 23.1 | |
| Tanner stage | 1.71 ± 0.95 | 2.47 ± 0.94 | 4.29 ± 0.46 | 4.27 ± 0.59 | 1.27 ± 0.59 | 1.76 ± 0.83 | 4.05 ± 0.52 | 3.76 ± 0.66 | |
| Ramp test | Peak VO2 (L/min) | 1.21 ± 0.30 | 1.61 ± 0.38 | 1.92 ± 0.45 | 1.98 ± 0.29 | 1.40 ± 0.41 | 1.60 ± 0.51 | 2.68 ± 0.60 | 2.85 ± 0.67 |
| Peak VO2 (ml/min/kg) | 35.7 ± 5.3 | 29.0 ± 5.7 | 33.7 ± 6.1 | 22.6 ± 6.3 | 39.9 ± 7.6 | 27.9 ± 8.0 | 41.4 ± 7.2 | 30.4 ± 8.0 | |
| Max Heart Rate (bpm) | 192.3 ± 12.8 | 193.9 ± 9.5 | 189.6 ± 11.9 | 183.1 ± 11.6 | 187.4 ± 9.9 | 186.7 ± 21.0 | 193.3 ± 11.7 | 190.5 ± 16.4 | |
| Max RQ | 1.13 ± 0.08 | 1.12 ± 0.06 | 1.15 ± 0.04 | 1.11 ± 0.08 | 1.09 ± 0.10 | 1.07 ± 0.06 | 1.17 ± 0.06 | 1.14 ± 0.05 | |
| Average Heart Rate (bpm) | 166.3 ± 10.1 | 159.2 ± 10.0 | 158.3 ± 15.0 | 153.4 ± 15.2 | 159.5 ± 13.1 | 161.4 ± 16.5 | 158.1 ± 9.8 | 159.4 ± 13.4 | |
| Constant Work Rate Protocol | Percent Work Rate* | 65.3 ± 9.6 | 68.1 ± 5.1 | 64.7 ± 7.9 | 66.4 ± 5.3 | 64.8 ± 6.1 | 73.3 ± 14.2 | 69.2 ± 4.4 | 67.2 ± 3.6 |
| Percent Heart Rate* | 86.8 ± 5.2 | 82.3 ± 5.7 | 83.6 ± 8.7 | 83.7 ± 6.1 | 85.2 ± 6.8 | 87.0 ± 9.6 | 82.6 ± 5.9 | 83.9 ± 6.3 | |
| Percent VO2* | 66.0 ± 11.0 | 65.7 ± 7.4 | 63.0 ± 7.8 | 67.8 ± 6.2 | 63.8 ± 13.8 | 68.9 ± 16.1 | 71.9 ± 10.6 | 68.5 ± 9.3 | |
| *Calculated as the proportion of average at the 10 Ã 2 test over the maximum at the ramp exercise | |||||||||
Table 1: Anthropometric and physiological characteristics.
Anthropometric measurements
Standard calibrated scales and stadiometers were used to determine height, body mass and body mass index (BMI=wt/ht2). We also calculated BMI percentile for each child using the published standards from the Centers for Disease Control, National Center for Health Statistics [7].
Pubertal status
Pubertal status was evaluated using a widely used validated self-administered questionnaire [8].
Measurement of fitness
Each participant performed a ramp-type exercise protocol on a cycle ergometer (Ergoline 800S, Yorba Linda, CA) using the Sensor Medics metabolic system. Participants were vigorously encouraged during the high-intensity phases of the exercise protocol. Gas exchange was measured breath-by-breath and the anaerobic (lactate) threshold and peak VO2 were calculated using standard methods [9].
At least 48 h, but not exceeding 7 days following the completion of the ramp test; each participant performed an exercise challenge consisting of ten, 2 min bouts, of constant work rate cycle ergometry separated by 1 min rest intervals. The constant work rate was individualized for each participant by using the work rate at the halfway point between the anaerobic (lactate) threshold and the peak oxygen uptake, which had been determined from the ramp test. This constant work rate was equivalent to approximately 65-75% peak work rate.
Blood sampling and analysis
Prior to performing the interval exercise protocol, an indwelling catheter was inserted into the antecubital vein. A baseline sample was taken after the placement of the catheter and before the onset of exercise. The sample was taken 30 min after catheter placement to ensure that measurable physiological parameters of stress (e.g. heart rate and blood pressure) were at baseline levels. Participants then completed the ten 2 min bouts of constant work rate and additional blood samples were obtained immediately after exercise. Complete blood counts (CBC) and differential for white blood cell analysis were obtained by standard methods from the clinical haematology laboratory at UC Irvine. Plasma lactate was measured before and after exercise using YSI 2300 STAT Plus Glucose and Lactate Analyser.
Statistical analysis
In order to evaluate baseline difference and exercise effect between different sex, age and weight group in the same model, we utilized a mixed model which incorporated repeated measurements from the same participant to construct an appropriate covariance matrix to appropriately examine their fixed effects on the outcome variables. For each of the outcome variables-lactate, leukocyte and leukocyte subtypes-the mixed model evaluated their interactions with sex, age and weight pre- exercise and post-exercise. Repeated measurements at pre- exercise and post-exercise from the same participant were used to construct additional covariance matrices. Descriptive statistics presented in tables are mean and standard deviation (SD), while results from mixed models are mean and standard error (SE). Fold change was calculated as peak-exercise over pre-exercise.
Anthropometric and physiological characteristics
The anthropometric and physiological characteristics of the 148 participants appear in Table 1. 79 (53.4%) were females, 75 (50.7%) aged 8-12 and 66 (44.6%) were overweight or obese (BMI percentile ≥ 85%). 21 (14.2%) of participants were Asian, 9 (6.1%) African-American, 86 (58.1%) Caucasian and 32 (21.6%) were Hispanic.
During the ramp test, participants achieved greater than 80% maximum heart rate and a respiratory exchange ratio (RER) equal or greater than 1.1, consistent with current standards that define acceptable efforts for peak VO2. No differences in maximal heart rate or RER as percent predicted were found among age groups. The relative exercise intensity determined as the average percentage for HR, WR and VO2 was not statistically significant across the groups. Overweight and obese children (BMI ≥ 85%) were grouped together for this analysis. A post-hoc analysis of leukocyte and lactate responses between overweight and obese groups ultimately revealed no difference.
Lactate and leukocyte response to exercise
| Girls | Boys | |||||||
|---|---|---|---|---|---|---|---|---|
| Age | 08-Dec | 13-18 | 08-Dec | 13-18 | ||||
| BMI %tile | <85 | = 85 | <85 | = 85 | <85 | = 85 | <85 | = 85 |
| N | 25 | 16 | 21 | 15 | 15 | 17 | 20 | 17 |
| Lactate (mmol/L) | ||||||||
| Pre-exercise | 1.75 ± 0.54 | 2.1 ± 0.85 | 1.65 ± 0.52 | 2.15 ± 0.74 | 1.7 ± 0.44 | 2.23 ± 0.85 | 1.62 ± 0.58 | 1.98 ± 0.78 |
| Post-exercise | 5.23 ±  2.06 | 5.56 ±  2.00 | 6.88 ±  2.52 | 7.65 ±  2.03 | 4.35 ±  1.59 | 5.46 ±  1.71 | 7.87 ±  2.85 | 7.62 ±  2.07 |
| Absolute change | 3.48 ±  2.08 | 3.46 ±  1.83 | 5.23 ±  2.71 | 5.7 ±  1.65 | 2.65 ±  1.51 | 3.23 ±  1.24 | 6.25 ±  2.62 | 5.65 ±  1.97 |
| Leukocyte (cells/ml) | ||||||||
| Pre-exercise | 5188 ± 1331 | 6359 ± 1420 | 6119 ± 1580 | 6807 ± 1423 | 5613 ± 1917 | 6388 ± 1660 | 5305 ± 1292 | 5918 ± 1419 |
| Post-exercise | 7938 ± 2459 | 9212 ± 2614 | 9881 ± 2601 | 10733 ± 2982 | 7327 ± 2123 | 9147 ± 1969 | 8555 ± 2037 | 9329 ± 1872 |
| Absolute change | 2750 ± 1461 | 2853 ± 1578 | 3376 ± 1677 | 3927 ± 1911 | 1713 ± 897 | 2759 ± 925 | 3250 ± 1076 | 3412 ± 1176 |
| Neutrophil (cells/ml) | ||||||||
| Pre-exercise | 2630 ± 964 | 3139 ± 1063 | 3581 ± 1379 | 3953 ± 1147 | 3047 ± 2042 | 3444 ± 1442 | 2865 ± 1064 | 3259 ± 1078 |
| Post-exercise | 3915 ± 1911 | 4202 ± 1442 | 5353 ± 1663 | 5730 ± 1959 | 4040 ± 2151 | 4719 ± 1731 | 4390 ± 1563 | 4600 ± 1353 |
| Absolute change | 1285 ± 1017 | 1063 ± 492 | 1563 ± 1041 | 1778 ± 955 | 993 ± 592 | 1275 ± 467 | 1525 ± 606 | 1341 ± 635 |
| Lymphocyte (cells/ml) | ||||||||
| Pre-exercise | 1996 ± 538 | 2597 ± 657 | 1955 ± 491 | 2254 ± 411 | 1773 ± 467 | 2063 ± 444 | 1885 ± 384 | 2035 ± 582 |
| Post-exercise | 3194 ± 1054 | 4161 ± 1479 | 3530 ± 1255 | 4065 ± 1406 | 2393 ± 723 | 3344 ± 765 | 3265 ± 824 | 3659 ± 1374 |
| Absolute change | 1198 ± 758 | 1564 ± 1055 | 1442 ± 1068 | 1811 ± 1207 | 620 ± 409 | 1281 ± 622 | 1380 ± 675 | 1624 ± 1114 |
| Monocyte (cells/ml) | ||||||||
| Pre-exercise | 369 ± 142 | 411 ± 111 | 413 ± 108 | 417 ± 176 | 440 ± 216 | 456 ± 159 | 405 ± 182 | 476 ± 182 |
| Post-exercise | 593 ± 201 | 598 ± 204 | 708 ± 253 | 697 ± 255 | 547 ± 300 | 644 ± 193 | 720 ± 161 | 753 ± 283 |
| Absolute change | 224 ± 147 | 187 ± 178 | 267 ± 249 | 280 ± 204 | 107 ± 191 | 188 ± 126 | 315 ± 153 | 276 ± 278 |
Table 2: Lactate level and leukocyte count and absolute change pre- and post- 10 Ã 2 exercise.
Table 2 presents the observed pre-exercise and post-exercise lactate levels and cell counts of total leukocyte and subtypes among gender, age and weight groups. Figure 1 displays baseline lactate, leukocyte and leukocyte subtype levels within each group and Figure 2 illustrates the effect of exercise on those groups. We found that baseline lactate level was significantly higher in overweight and obese compared to normal weight children (2.11 ± 0.08 vs. 1.68 ± 0.07 mmol/L, respectively, p=0.0001) and the pre-exercise to post-exercise lactate change was significantly greater in older children compared to younger children (5.71 ± 0.24 vs. 3.26 ± 0.24, respectively, p<0.0001).
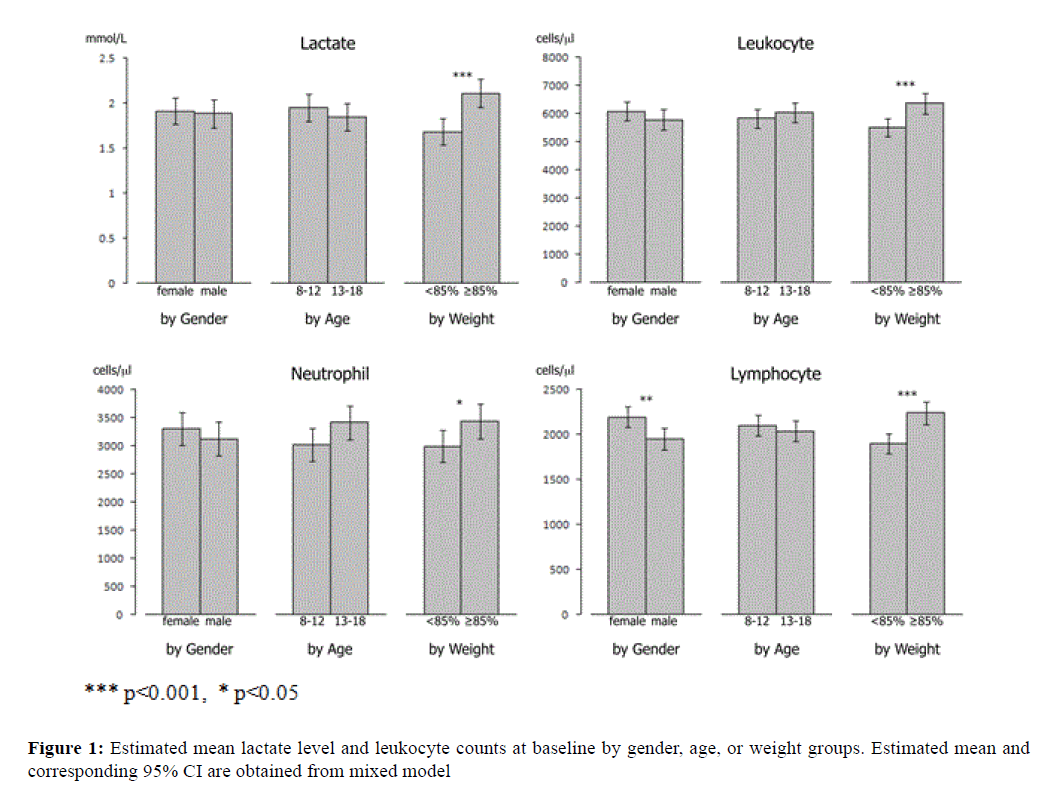
Figure 1: Estimated mean lactate level and leukocyte counts at baseline by gender, age, or weight groups. Estimated mean and corresponding 95% CI are obtained from mixed model.
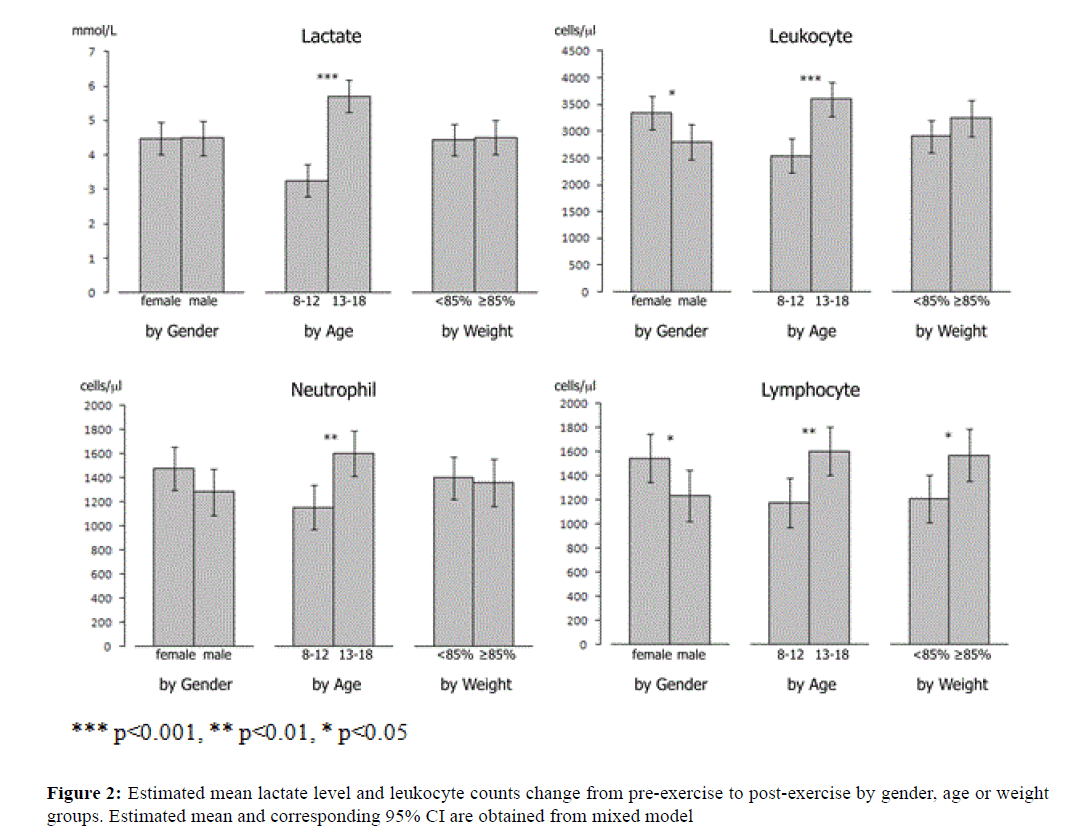
Figure 2: Estimated mean lactate level and leukocyte counts change from pre-exercise to post-exercise by gender, age or weight groups. Estimated mean and corresponding 95% CI are obtained from mixed model.
Similarly, the baseline leukocyte level was significantly higher (p=0.0009) in overweight (6362 ± 186 cells/ml) than in normal weight children (5511 ± 168) and the pre- exercise to post-exercise WBC change was significantly greater (p<0.0001) in older children (3599 ± 165) than in younger children (2544 ± 163).
For leukocyte subtypes, the baseline lymphocyte was significantly lower (p=0.0044) in boys (1948 ± 62 cells/ml) than in girls (2193 ± 58) and significantly higher (p<0.0001) in overweight children (2241 ± 63) than in normalweight children (1900 ± 57); the baseline neutrophil was also significantly higher (p=0.041) in overweight children (3438 ± 160) than in normal-weight children (2994 ± 143).
In addition, the pre-exercise to post-exercise change in leukocyte levels was significantly higher (p=0.021) in in girls (3343 ± 160) than in boys (2799 ± 169). After the interval exercise test, the lymphocyte increased significantly more (p=0.037) in girls (1547 ± 101) than in boys (1236 ± 107), significantly more (p=0.004) in older children (1606 ± 104) than in younger children (1177 ± 104) and also significantly more (p=0.015) in overweight children (1573 ± 110) than in normal-weight children (1211 ± 98). The neutrophil and the monocyte increased, after exercise, significantly more (p=0.001 & p=0.0007) in older children than (1604 ± 95 & 293 ± 23) in younger children (1155 ± 94 & 181 ± 23). Figure 3 shows that the median fold change pre- to post-exercise in lactate levels was 2.7 (range 1.4 to 8.1) in younger children and 4.1 fold (1.7 to 9.6) in older children, while the median fold change in leukocyte levels was 1.4 (1.0 to 2.1) in younger children and 1.6 fold (1.2 to 2.8) in older children, with a significantly higher (p<0.001) leukocyte to lactate ratio in younger children than older children.
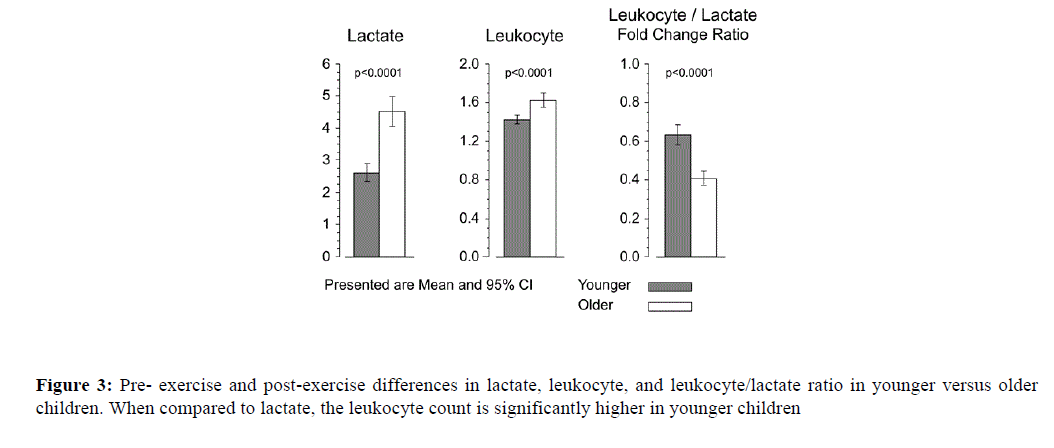
Figure 3: Pre- exercise and post-exercise differences in lactate, leukocyte, and leukocyte/lactate ratio in younger versus older children. When compared to lactate, the leukocyte count is significantly higher in younger children.
Figure 4 demonstrates the leukocyte subsets response compared to the lactate response following exercise, with a higher neutrophil and lymphocyte subset response in the younger children when compared to lactate response.
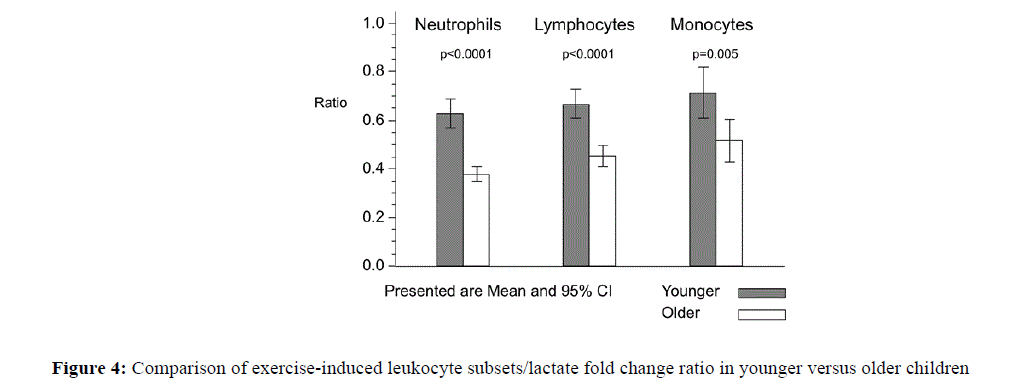
Figure 4: Comparison of exercise-induced leukocyte subsets/lactate fold change ratio in younger versus older children.
Traditionally, exercise response is characterized by either its immunological or metabolic indices, but not both. While lactate and leukocyte levels reflect metabolic and immune behaviours, they also are related to stress. Because we could not completely separate the lactate and leukocyte responses, we also evaluated both markers simultaneously by comparing their responses as a ratio. Our results show that the lactate and leukocyte responses to the same relative submaximal exercise intensity were significantly greater in older children compared to younger children. Leukocyte response was also higher post-exercise in females compared to males. Younger children demonstrated a larger ratio of leucocytosis to lactate response following exercise. It is often challenging to compare exercise effects in children given varying body mass, maturational differences and fitness levels [10]. We addressed this by scaling, the work rate to the physiologic capabilities of each individual. Consequently, our findings add information to the few paediatric studies that have demonstrated growth-related changes in immune cell trafficking in response to physical activity [2].
The mechanisms responsible for the larger exercise-associated elevations in total leukocyte and leukocyte subpopulation counts in older compared to younger children are unclear. We speculate that this observation may be related to maturational differences in stress and inflammation related particularly to oxygen availability and tissue uptake during exercise. It is well established that conditions of reduced oxygen delivery/availability lead to an inflammatory state characterized by higher leukocyte and lactate level [11]. Work from this and other laboratories indicates that younger children utilize more oxygen and produce less lactate during high-intensity exercise than do older children and adults [12]. Consequently, the attenuated leukocyte response to exercise in younger children may parallel the smaller lactate response and indicate relatively lower inflammatory activation during heavy exercise. Along these lines, earlier studies from our exercise lab have shown that brief exercise could lead to alterations in inflammatory gene expression, which may influence the leukocyte response [13]. A study by Dotan et al. [14] speculated that the rate of lactate elimination was similar despite age differences and that higher post-exercise lactate concentrations in older children were related to an increased lactate production in those older children rather than increased lactate clearance in younger children supporting the notion that heavy exercise in younger children is less inflammatory.
We had hypothesized that the association between the lower lactate and leukocyte response in younger children would be proportionally similar to the higher lactate and leukocyte response in older children. We anticipated, but did not find, that the exercise-induced Δleukocyte/Δlactate would be the same in the two groups since both lactate and leukocytes are indicators of metabolic stress and part of the pro-inflammatory state, which, as noted, develops under stressful conditions such as exercise and hypoxia [15]. Whether the unexpected differences in the Δleukocyte/ Δlactate ratios resulted from a maturation-related altered pattern of leukocyte trafficking in the younger children is not known. We also examined two other possible factors, BMI and sex, that could influence lactate and leukocyte dynamics in response to exercise. In this study, body weight-related differences were seen in the lactate and leukocyte levels at rest and in response to exercise. Corroborating findings from this and other exercise laboratories, higher BMIs have been associated with higher lactate concentration and higher leukocyte levels at rest [16]. Interestingly, out of the leukocyte subtypes measured in this study, only the increase in lymphocytes seemed to be significant in the overweight group in response to exercise.
There was a small but significant sex effect across all ages with females having a higher leucocytosis in response to exercise compared to males. Interestingly, this sex-related difference was not accompanied by a corresponding sexrelated difference in lactate response to exercise. Although the mechanism related to the higher leucocytosis response in females remains unclear, we speculate that perhaps it may be related to different dynamics in blood flow and oxygen transport in exercise that is suggested by Winsley et al. [17].
These results highlight the need to control for age and sex when interpreting immunologic responses to exercise in a paediatric population. The mechanisms for how these different perturbations in leukocyte and lactate mobilization following exercise contribute to healthy growth and development still need further investigation.
This work was supported in part by National Institutes of Health grants P01HD-048721, the UCI Institute for Clinical and Translational Science (CTSA grant) UL1RR031985 and the UC Irvine Multidisciplinary Exercise Sciences Training Program (5 T32 AR047752-09).