Research Article - European Journal of Sports & Exercise Science ( 2019) Volume 7, Issue 2
Received: 01-Apr-2019 Published: 17-Apr-2019
Globally exists an ongoing battle between increasingly advanced doping methods and limited resources available to anti-doping organizations. Therefore, the developments of new tools for identifying athletes who may be doping are needed. Recognizing which athletes are at the highest risk of doping allows an anti-doping organization to distribute those limited resources in the most effective manner. Presented below is a comparison of multiple machines
and statistical learning approaches, combined with resampling techniques, to identify which athletes are at the highest risk of doping. The results presented indicate that support vector classification and logistic regression, combined with oversampling, may provide an effective tool to aid anti-doping organizations in most effectively distributing scarce resources. Adoption and implementation of these methods may both enhance the deterrence effect of anti-doping, as well as increases the likelihood of catching athletes doping. Future research should be conducted to explore the feasibility of combining these performance-based measures with biological measures such as the Athlete Biological Passport to enhance anti-doping efforts.
Anti-doping, Performance modeling, Machine learning, Mixed-martial-arts, Sports.
ABP: Athlete Biological Passport; AUC: Area Under Curve; FN: False Negative; FP: False Positive; GNB: Gaussian Naïve Bayes; MNB: Multinomial Naïve Bayes; NPV: Negative Predictive Value; PED: Performance Enhancing Drug; PPV: Positive Predictive Value; RF: Random Forest; SVM: Support Vector Machine; TN: True Negative; TP: True Positive; USADA: United States Anti-Doping Agency
In the world of sport, the use of banned Performance-Enhancing Drugs (PEDs) or methods is referred to as doping. Driven by the goal of obtaining an advantage over their competitor, some athletes look to artificially enhance their abilities. The estimated prevalence of doping in sport can be above 40% depending upon variables such as sport, country, and competition level [1-6]. However, only 1% to 2% of doping samples collected annually test positive for a banned substance (WADA 2012-2016). Thus, improved strategies that offer more robust, objective, and effective means of detection are needed.
Early PED testing methods relied heavily on the direct detection of the banned substance(s) in the biological sample collected from the athlete. However, current methods have shifted towards a more forensic approach with the implementation of the ABP [7,8]. The ABP measures multiple biomarkers that change in response to the use of a PED, which can indirectly reveal doping has occurred. Although the ABP has shown to be a successful deterrent and strategic testing tool, others have shown confounding factors (genetic polymorphisms and medications) or delivering PEDs in micro-doses can mask changes in biomarkers measured by the ABP [9-13]. Therefore, new tools for identifying athletes who may be doping are needed.
One emerging strategy, similar to that of the ABP, is to incorporate the tracking of athlete performance as another indirect marker of doping. Indeed, performance measures of many Olympic sports are well studied, with elite athlete’s performance varying less than 2.0% (0.6% to 1.4%) in sprint and endurance sports like running and cycling [14]. Additionally, elite athletes in weightlifting and field events, which require more explosive power in a single effort, exhibit performance varying less than 4.0% (1.4% to 3.3%) [14]. Thus, the development of monitoring changes in athlete performance may indeed be another indirect marker of doping as recently demonstrated [15-17]. Furthermore, creating a mathematical performance model to measure critical power has been proposed as a sensitive method to detect performance modifying manipulations such as PED use [17]. The utilization of such modeling techniques has not been fully explored in the field of anti-doping but has been used effectively to better understand diseases. In fact, similar machine-learning algorithms have been shown to improve with the detection and diagnosis of many life-threatening diseases [18-22]. Thus, the implementation of machine-learning based classification models or neural networks may aid in the detection of PED use.
The goal of this paper was to develop and compare multiple classification models using career performance data from athletes who have been sanctioned for doping. For this purpose, five different supervised classification models were utilized: Support Vector Machine [23], Random Forest [24], Multinomial Naïve Bayes [25], Logistic Regression [26], and Gaussian Naïve Bayes [25]. Statistical analyses were also done to examine the performance of each model. In addition, sanctioned athlete’s performances were evaluated to gain a better understanding of their fighting profile. Presented here is a novel method, using machine learning approaches, to better identify athletes who may have used PEDs.
UFC athletes tested by the US Anti-Doping Agency (USADA) from July 2015 through May 2018 were included the dataset. For these athletes, career performance data was obtained for athletes who had competed in a minimum of one fight in the UFC from January 2015 to May 2018. Given the relatively low population, female athletes were not included in this analysis. Athletes were identified as having engaged in doping if they had publicly received a sanction for a doping-related offense from USADA.
All athlete data was obtained from the mixed martial arts data aggregation website Fightmetric.com. The performance data below was utilized in addition to fighting time, and athlete age. To determine if any differences existed between this data from non-sanctioned athletes and sanctioned athlete, unpaired t-test with Welch’s correction was performed using GraphPad Prism version 7.03, GraphPad Software, La Jolla California USA.
Performance data
Longest average fight time measured in seconds; minimum 5 UFC fights
Significant striking accuracy; minimum 5 UFC fights and 350 significant strike attempts
Significant strike defense (the % of opponent’s strikes that did not land); minimum 5 UFC fights and 350 significant strike attempts
Takedown accuracy; minimum 5 UFC fights and 20 takedown attempts
Takedown defense (the % of opponents TD attempts that did not land); minimum 5 UFC fights and 20 takedown attempts by opponents
Takedowns landed
Knockdowns landed
Submission average per 15 minutes; minimum 5 UFC fights
Significant strikes landed per Minute; minimum 5 UFC fights
Significant strikes absorbed per Minute; minimum 5 UFC fights
Machine-learning based classification models used include Support Vector Machine (SVM), Random Forest (RF), Multinomial Naïve Bayes (MNB), Logistic Regression, and Gaussian Naïve Bayes (GNB). All classifiers were trained using Python [27] version 3.6.5) and the scikit-learn (version 0.19.1) as previously described [28]. A parameter search was done to optimize each model to accurately predict sanctioned athletes [29,30]. More specifically, a coarse grid search using 5-fold cross-validation was performed via the GridSearchCV method of the scikit-learn library utilizing a 50/50 train/test split [28]. Parameter performance was evaluated based on the F1 score, where 1 is the best and 0 is the worst. The linear SVM model was trained with the scikit-learn SVM method using: the penalty parameter set at 0.1, a linear kernel, class weight inversely proportional to the frequency of occurrence, and predictor variables not rescaled or normalized. The RF model was trained using the RandomForestClassifier method of the scikit-learn ensemble module while changing the size of the forest from 10 trees to 100. For the MNB model, predictor variables were first transformed from continuous variables to categorical variables utilizing the LabelEncoder method of the scikit-learn preprocessing module prior to training utilizing the MultinomialNB method of the scikit-learn naïve bayes module. The LR model was trained using the scikit-learn LogisticRegression method with L2 regularization, Newton Cost Gradient solver, fit with a y-intercept, and class weight adjusted to be inversely proportional to the frequency of occurrence. However, prior to training, predictor variables were rescaled and normalized to ensure each predictor variable had a mean of 0 and a standard deviation of 1 using the StandardScaler method of scikit-learn. For the GNB model, predictor variables were transformed utilizing the same method for the MNB model, and then rescaled and normalized using the method previously described for the Logistic Regression classifier. The GNB model was trained using the default values of the GaussianNB method in the scikit-learn naïve bayes module.
The presented data set was comprised primarily of non-sanctioned athlete performance data (majority class) and a small percentage of sanctioned athlete performance data (minority class) in a roughly 96/4 split. Therefore, the Tomek links undersampling [31] technique and Synthetic Minority Oversampling Technique (SMOTE) [32] were utilized to achieve better classifier performance. Briefly, the Tomek links technique removes cases of the majority class when those cases are highly similar to cases in the minority class, thus enhancing the boundary between classes. Tomek links were applied to training sets using the Tomek links method of the imblearn package [33]. Default parameters were used with the following two exceptions: ratio set to the majority and return indices set as true. Inversely, SMOTE is a method of addressing the class imbalance in classification problems by creating synthetic examples of the minority class. SMOTE was applied to training data sets via the SMOTE method of the imblearn package [33]. Default parameters were used with the following two exceptions: ratio set to minority and kind set to borderline1.
Measures used to evaluate the performance of each classification model include: Area under Curve (AUC), F1, Sensitivity, Specificity, Accuracy, True Positive (TP), True Negative (TN), False Positive (FP), False Negative (FN), Positive Predictive Value (PPV), and Negative Predictive Value (NPV) for each model permutation. The measures of accuracy, sensitivity, specificity, TP, TN, FP, FN, PPV, and NPV were generated using the confusion matrix as previously outlined [34-36]. Evaluation metrics averaged across 5-fold cross-validation for all models are presented in Table 1. The number of predicted doping athletes was found by predicting the probability of class membership for each example. Athletes were classified as doping if the probability of class membership was greater than 0.50. The cross-validated model of each permutation was used to calculate probability.
| Tomek | SMOTE | AUC | FI | Sensitivity | Accuracy | PPV | NPV | FP | FN | TP | TN | |
|---|---|---|---|---|---|---|---|---|---|---|---|---|
| SVC | Yes | Yes | 0.610 | 0.097 | 0.596 | 0.480 | 0.053 | 0.961 | 79.200 | 3.000 | 4.400 | 71.600 |
| Yes | No | 0.560 | 0.000 | 0.000 | 0.953 | 0.000 | 0.953 | 0.000 | 7.400 | 0.000 | 150.800 | |
| No | Yes | 0.570 | 0.092 | 0.575 | 0.485 | 0.051 | 0.960 | 78.200 | 3.200 | 4.200 | 72.600 | |
| No | No | 0.530 | 0.000 | 0.000 | 0.953 | 0.000 | 0.953 | 0.000 | 7.400 | 0.000 | 150.800 | |
| Random forest | Yes | Yes | 0.650 | 0.126 | 0.107 | 0.928 | 0.148 | 0.957 | 4.600 | 6.600 | 0.800 | 146.200 |
| Yes | No | 0.660 | 0.178 | 0.107 | 0.953 | 1.000 | 0.958 | 0.000 | 6.600 | 0.800 | 150.800 | |
| No | Yes | 0.660 | 0.171 | 0.164 | 0.930 | 0.200 | 0.959 | 4.800 | 6.200 | 1.200 | 146.200 | |
| No | No | 0.660 | 0.183 | 0.111 | 0.953 | 1.000 | 0.958 | 0.000 | 6.600 | 0.800 | 150.800 | |
| Multinomial naive bayes | Yes | Yes | 0.510 | 0.063 | 0.293 | 0.591 | 0.036 | 0.945 | 59.600 | 5.200 | 2.200 | 91.200 |
| Yes | No | 0.480 | 0.000 | 0.000 | 0.948 | 0.000 | 0.953 | 0.800 | 7.400 | 0.000 | 150.000 | |
| No | Yes | 0.510 | 0.073 | 0.354 | 0.598 | 0.042 | 0.951 | 58.800 | 4.800 | 2.600 | 92.000 | |
| No | No | 0.490 | 0.000 | 0.000 | 0.946 | 0.000 | 0.953 | 1.200 | 7.400 | 0.000 | 149.600 | |
| Logistic regression | Yes | Yes | 0.580 | 0.111 | 0.407 | 0.696 | 0.064 | 0.961 | 43.600 | 4.400 | 3.000 | 107.200 |
| Yes | No | 0.620 | 0.104 | 0.468 | 0.633 | 0.059 | 0.961 | 54.000 | 4.000 | 3.400 | 96.800 | |
| No | Yes | 0.600 | 0.127 | 0.489 | 0.685 | 0.073 | 0.965 | 46.000 | 3.800 | 3.600 | 104.800 | |
| No | No | 0.600 | 0.105 | 0.482 | 0.625 | 0.061 | 0.962 | 55.600 | 3.800 | 3.600 | 95.200 | |
| Gaussian naive bayes | Yes | Yes | 0.580 | 0.124 | 0.436 | 0.731 | 0.077 | 0.964 | 38.400 | 4.200 | 3.200 | 112.400 |
| Yes | No | 0.670 | 0.000 | 0.000 | 0.951 | 0.000 | 0.953 | 0.400 | 7.400 | 0.000 | 150.400 | |
| No | Yes | 0.580 | 0.121 | 0.400 | 0.727 | 0.072 | 0.962 | 38.800 | 4.400 | 3.000 | 112.000 | |
| No | No | 0.660 | 0.000 | 0.000 | 0.953 | 0.000 | 0.943 | 0.000 | 7.400 | 0.000 | 122.000 |
Table 1: Altering Sampling Size: Comparison of sanctioned athlete classification performance of four classification models utilizing either no sampling alteration, Tomek links undersampling, SMOTE oversampling, or both; Model performance metrics reported include Area under Curve (AUC), F1 score, sensitivity, specificity, accuracy, positive predictive value (PPV), negative predictive value (NPV), false positive rate (FP), false negative rate (FN), true positive rate (TP), and true negative rate (TN)
As shown in Table 2, UFC athletes sanctioned for doping are significantly older (32.6 years old) compared to athletes who have not been sanctioned (30.9 years old). Additionally, of the nine performance measures, sanctioned athletes have a significantly greater takedown accuracy. Although takedown accuracy was the only performance measure to be significantly different, similar performance measures such as takedown defense and takedowns landed were higher in sanctioned athletes. To better understand if sanctioned athletes exhibit a similar “fighting strategy,” the percent difference was calculated for each of the nine performance measures as well as fight time and age. Figure 1 illustrates sanctioned UFC athletes tend to excel in offensive and defensive takedown-based movements. Furthermore, sanctioned athletes tend to land more significant strikes per minute but knock their opponent down less and attempt fewer submissions. These data suggest sanctioned UFC athletes may employ a similar fighting strategy, best described as “ground-and-pound,” to fighting an opponent.
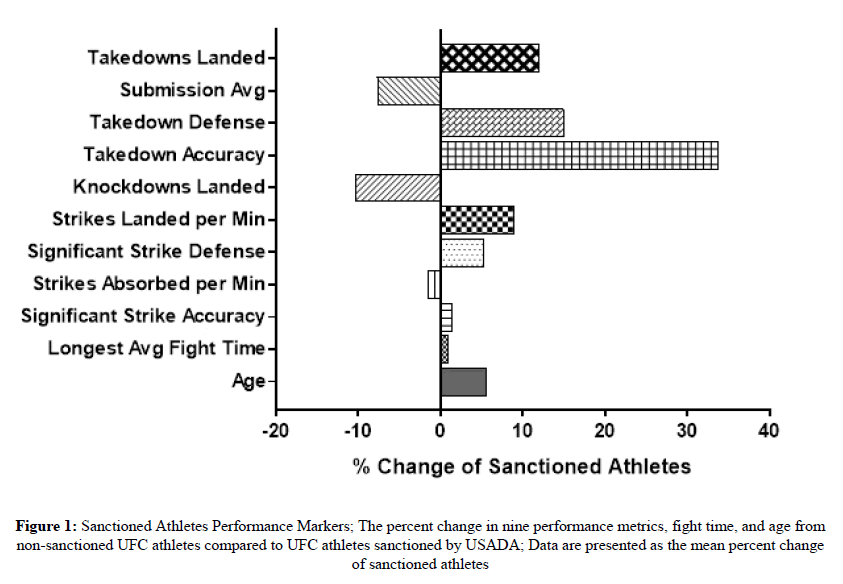
Figure 1: Sanctioned Athletes Performance Markers; The percent change in nine performance metrics, fight time, and age from non-sanctioned UFC athletes compared to UFC athletes sanctioned by USADA; Data are presented as the mean percent change of sanctioned athletes.
| UFC performance markers | Non-Sanctioned (n=754) | Sanctioned (n=37) | p-value |
|---|---|---|---|
| Age | 30.9 ± 4.26 | 32.6 ± 4.23 | 0.021* |
| Longest average fight time | 636.0 ± 200.7 | 642.1 ± 144.9 | 0.808 |
| Significant strike accuracy | 0.44 ± 0.09 | 0.44 ± 0.12 | 0.739 |
| Significant strike defense | 0.56 ± 0.09 | 0.59 ± 0.11 | 0.099 |
| Takedown accuracy | 0.37 ± 0.24 | 0.50 ± 0.29 | 0.014* |
| Takedown defense | 0.58 ± 0.27 | 0.67 ± 0.31 | 0.107 |
| Submission average | 0.69 ± 1.2 | 0.63 ± 0.76 | 0.693 |
| Takedowns landed | 1.60 ± 1.5 | I.79 ± 1.49 | 0.449 |
| Knockdowns landed | 0.50 ± 2.4 | 0.45 ± 0.45 | 0.656 |
| Strikes landed per minute | 3.40 ± 2.4 | 3.71 ± 1.7 | 0.309 |
| Strikes absorbed per minute | 3.34 ± 1.4 | 3.28 ± 2.1 | 0.88 |
Table 2: UFC performance markers, analysis of nine performance metrics, fight time, and age from non-sanctioned UFC athletes compared to UFC athletes sanctioned by USADA; data are presented as means ± SD; * significantly different (p<0.05)
The performance of each classification model with each permutation is shown in Table 1.
Many of the model permutations may not be useful anti-doping tools based on their inability to discriminate between sanctioned and non-sanctioned athletes. For example, any model that failed to identify a single TP can be discarded as this means they were not able to identify a sanctioned athlete. In addition, any model permutation which has accuracy greater than 90% may also not be useful for anti-doping purposes, as these models are likely simply classifying all examples as not sanctioned. Similar to accuracy, models with specificity greater than 95% may also be a misleading performance measure. This is primarily due to the imbalanced nature of the dataset, where a model which simply classifies all examples as the majority class (non-sanctioned) may still be highly accurate and specific despite having no discriminatory value. Models with an accuracy and specificity greater than 90% proved unable to classify more than 1 athlete as a TP. Therefore, it may be appropriate to eliminate any models with a low TP rate and high accuracy and specificity since they are not able to differentiate between classes. All RF models and SVC and Naïve Bayes models which did not utilize SMOTE over-sampling can be ruled out as suitable anti-doping tools based on their inability to distinguish between doping and non-doping athletes.
Due to class imbalance, some metrics may not be the most appropriate for anti-doping organizations to consider when evaluating model performance while utilizing specific model and sampling alteration combinations may be more appropriate. For each RF, SVC and Naïve Bayes classification models, over-sampling of the minority class resulted in improved sensitivity, PPV, FP rate, and TP rate when compared to either under-sampling of the majority class alone or no sampling alterations. Therefore, it could be concluded with this data set, classification models not implementing over-sampling of the minority class, via SMOTE, are unable to distinguish between classes. However, for each LR algorithm, this trend did not hold true as each model permutation performed similarly with only TN rate increasing with oversampling. SVC with under- and over-sampling or only over-sampling, any permutation of LR, and Naïve Bayes models with combined under- and over-sampling may be most appropriate for anti-doping purposes. As shown in Table 1, these models displayed sensitivity greater than 25%, specificity and accuracy greater than 45%, a TN rate less than 6, and were able to correctly classify more than 1 athlete in the minority class.
As an additional measure to evaluate each model’s performance, the number of athletes classified in the minority class (doping) was evaluated. As shown in Table 3, all models except RF were able to classify more than 25% of athletes as doping with at least two model permutations. More specifically, RF models were only able to classify less than 5% of athletes as doping while only Naïve Bayes models utilizing SMOTE oversampling were able to classify more than 25% of athletes as doping. Multinomial Naïve Bayes with oversampling was able to classify roughly 10% more athletes as doping than GNB with oversampling. However, SVC and LR were able to classify 28% or more athletes as doping regardless if under- or over-sampling was applied. In fact, utilizing either SMOTE or Tomek did not appear beneficial for LR regarding classifying athletes as doping.
| Models | Tomek | SMOTE | # of Athlete Classified as Doping | % of Athlete Population |
|---|---|---|---|---|
| SVC | Yes | Yes | 318 | 40.20% |
| Yes | No | 287 | 36.30% | |
| No | Yes | 306 | 38.70% | |
| No | No | 304 | 38.40% | |
| Random Forest | Yes | Yes | 35 | 4.42% |
| Yes | No | 30 | 3.79% | |
| No | Yes | 36 | 4.55% | |
| No | No | 30 | 3.79% | |
| Multinomial naive bayes | Yes | Yes | 301 | 38.10% |
| Yes | No | 0 | 0.00% | |
| No | Yes | 311 | 39.30% | |
| No | No | 6 | 0.76% | |
| Logistic regression | Yes | Yes | 234 | 29.60% |
| Yes | No | 277 | 35.00% | |
| No | Yes | 223 | 28.20% | |
| No | No | 306 | 38.70% | |
| Gaussian naive bays | Yes | Yes | 221 | 27.90% |
| Yes | No | 1 | 0.13% | |
| No | Yes | 212 | 26.80% | |
| No | No | 0 | 0.00% |
Table 3: Classification model performance: Evaluation of four classification models utilizing either no sampling alteration, Tomek links undersampling, SMOTE oversampling, or both to classify UFC athletes as doping; Data are presented as the number classified or a percentage of the total sampled population (n=791)
Strategically testing athletes is critical for both maximizing the detection of PED use and increasing deterrence. Additionally, to maximize limited anti-doping resources, utilizing a tool which may help identify athletes using PEDs will enhance anti-doping efforts. Although a growing number of sources compile data on an athlete’s performance, leveraging this information for anti-doping purposes is still being explored. The concept of longitudinally monitoring an athlete’s performance for abnormalities has been proposed as another way to indirectly detect the use of PEDs [15-17,37]. Again, since the main objective of using a PED is to alter one’s performance, identifying atypical competition results may indeed be a valuable tool for anti-doping programs. Presented here is a machine-learning based approach that compared different classification models for identifying athletes who may have used PEDs based on career performance.
Regardless of the application, any classification model should be chosen based on its performance. However, for the purposes of anti-doping, the most important metrics on how to evaluate the performance of a classification model may be those which most directly relate to the minority class (athletes sanctioned for doping). For example, accuracy may be an inappropriate evaluation metric given the large imbalance in the dataset presented here or that exists globally (WADA 2012-2016). This imbalance can result in the failure of a model to identify any athletes sanctioned for doping but still result in a misleadingly high accuracy value. Therefore, similar to accuracy, specificity may also be an unsuitable metric to measure. Specificity indicates the ratio of TNs to TNs and FPs combined, thus a low value for specificity indicates a higher degree of appropriateness of a model for anti-doping purposes. Although a large specificity value indicates a low number of FPs in comparison to the number of TNs, a relatively high FP rate may be “desirable” for anti-doping purposes, as athletes in this category may be at a higher risk for doping despite having not been sanctioned.
Three classification model performance metrics which may be valuable for anti-doping purposes are sensitivity, FP rate, and FN rate. The sensitivity indicates the ratio of TPs to TPs and FNs combined, thus the higher the sensitivity, the more likely this model will correctly identify athletes who have used a banned substance. As previously mentioned, a high FP rate, or type 1 error, may not be problematic in the anti-doping setting. In this context, FP rate in a classification task represents athletes who have not tested positive for a prohibited substance, but who have a high likelihood of testing positive based on similar performances to those athletes who have been sanctioned. Therefore, employing classification models that have a large number of false positives may be one way for antidoping organizations to identify athletes in need of additional testing. However, this is in contrast with type 2 errors, or FN rate, which represents athletes who have been sanctioned for using a prohibited method or substance but are not identified as such. For anti-doping organizations, classification models with a high FN rate would have the consequence of incorrectly classifying an athlete using a prohibited substance as not. This poses a danger for a combat sport like the UFC as it could allow a doped athlete into the Octagon and lead to serious injury to the opposing fighter.
Another possible performance metric to evaluate each classification model would be the number of athletes classified as doping from each model permutation. Previous work using various surveys has estimated doping prevalence in sport to be anywhere from 4% to more than 45% depending on the sport [1-6]. Similarly, at least one model permutation from each different classification model was able to classify between 3% and 40% of the athlete population as doping. Even though these are very different methods to assess doping in sport, the agreements suggest a current methodology for selecting athletes for biological testing may need improvement. Therefore, developing a classification model which incorporates an athlete’s performance and biological markers may be one method to optimally employ anti-doping resources.
Resources, expertise, and access to data on an athlete’s performance may be some of the limiting factors when trying to investigate if the presented concept could be applied to other sports. One limitation in this study was the use of career performance across all fights and not individual performances each fight. By using career performances, the assumption is being made the athlete has used a PED for a large portion of their career which may not be the case. Future studies should explore if individual performances improve classification models ability to identify doped athletes. An additional limitation of this study not explored is the role athletic equipment and apparel plays in an athlete’s performance. For example, a difference of ~ 1 m in the shot put performance may be suggestive of doping [37]. However, a runner’s shoe choice could alter their peak vertical ground reaction force, step frequency, and ground contact time, all translating into an improved running velocity by ~ 3.4%. Thus, whatever methodology used to monitor an athlete’s performance for anti-doping purposes may need to be sport and discipline-specific to account for many of the confounding factors.
In summary, multiple machine learning based classification models were investigated to determine how athlete performance could be used to identify the use of banned performance-enhancing drugs. To address the imbalance found in the dataset, each model examined if sampling alterations could improve each model’s ability to differentiate sanctioned and non-sanctioned athletes. Under-sampling of the majority class via Tomek links did not improve model performance on test sets, while over-sampling of the minority class via SMOTE improved performance in all algorithms compared to no sampling alterations [38-40]. Based on these findings, as well as others, the creation of an athlete’s performance passport may indeed advance anti-doping efforts. The integration of performance measures with existing biological markers (ABP), investigating more sophisticated machine learning methods, and considering the implementation of more sophisticated over-sampling techniques are all ways to better identify athletes who may have used a banned PEDs.