Research Article - European Journal of Sports & Exercise Science ( 2018) Volume 6, Issue 3
Estrogen, Exercise, Muscle damage, Menstrual cycle, Neuromuscular electrical stimulation, Myokines, Atrogenes.
Exercise-induced muscle damage up-regulates inflammation and catabolic pathways [1,2]. Leukocytes quickly infiltrate damaged fibres to remove debris [3]. This triggers regeneration [4], which is dependent on activation of satellite cells [5,6]. Interleukin (IL)-6 and Tumor Necrosis Factor (TNF)-α are generated from leukocytes [5] and activated satellite cells to proliferate and fuse with damaged fibers for protein synthesis augmentation [6]. The catabolic transcription factor myostatin (Mstn), returns satellite cells to quiescence, maintaining the reserve [2,7]. In parallel, activation of mammalian target of rapamycin (mTOR), the major pathway contributing to muscle protein synthesis, is induced by muscle contraction [8]. Repeated cycles lead to muscle hypertrophy over time.
Alterations in protein synthesis/degradation are regulated by mechanisms determining whether the net balance is catabolic or anabolic [9]. These mechanisms are largely coordinated by the phosphoinositol-3-kinase (PI3K)/Akt/ mTOR/Forkhead boxO3a(FOXO3a) pathways [10]. mTOR is also activated by Akt, and Akt regulates FOXO3a [11, 12], a catabolic gene that up-regulates two atrogenes (atrophy-inducing genes), muscle atrophy F-box (MAFbx) and muscle RING finger 1 (MuRF-1) [13-16]. Akt phosphorylates FOXO3a, causing translocation into the cytoplasm where its transcriptional activity is inhibited [14,17-19]. During catabolic conditions, Akt activity decreases, allowing FOXO3a to return to the nucleus [20]. MAFbx targets the myogene MyoD [21,22], while MuRF-1 targets the myosin heavy chain, for degradation [23,24]. Mstn is a powerful negative regulator of muscle mass and reduces Akt activation and mTOR signalling [25].
Estrogen may attenuate catabolic and inflammatory pathways in skeletal muscle. Estrogen-containing hormone therapy (HT) reduced muscle atrophy in post-menopausal women [26-30] and reduced global measures of muscle damage in young women [31,32]. Williamson et al. examined FOXO3a signalling after 12 weeks of resistance training in young (24 ± 2 years) and elderly (85 ± 1 years) women; no elderly women used HT [33].
The abundance of activated FOXO3a was increased in elderly women. MuRF-1 and Mstn decreased in young women while Mstn increased in elderly women. Dieli-Conwright et al. examined the influence of estrogen on the catabolic mRNA response to maximal eccentric contractions between postmenopausal women using or not using HT [34,35]. Inflammation (IL-6, IL-8, IL-15, TNF-α) was blunted [34] and Mtsn down-regulation was greater in HT users [35], suggesting estrogen may reduce intramuscular damage.
Neuromuscular Electrical Stimulation (NMES) has been used to investigate contraction-induced muscle damage [36-43]. NMES-evoked isometric contraction-induced muscle damage is similar to that induced by voluntary eccentric contraction [46,47] and may induce greater muscle damage than voluntary eccentric contractions for knee extensors [44]. The estrogen influence on NMES-induced muscle damage has not been studied.
We hypothesized that NMES-induced catabolic and inflammatory signalling will be attenuated during the luteal phase of the menstrual cycle or during Oral Contraceptive (OC) consumption compared to menses. No investigations have examined the hormonal influence on atrogene or inflammatory gene expression after NMES in young women. This investigation may provide evidence for an estrogen-related reduction of muscle damage after NMES, which could have direct implications for muscle damage after voluntary exercise.
Participants
The study protocol was approved by the University of Southern California (USC) Health Sciences Campus (HSC) Institutional Review Board and is in accordance with the ethical standards of the 1964 Declaration of Helsinki. Participants were recruited from USC, local colleges, and surrounding suburban areas and provided written informed consent before study enrollment. All study visits occurred in the Clinical Exercise Research Center (CERC) at the HSC.
Participants were screened at Visit 1 for current and recent history of 1) contraceptive use, 2) exercise/recreational activity, and 3) general health before performing any test procedures. All participants satisfied the following criteria: woman; age 21-30; body mass index (BMI) 19-25; no hormonal contraception within the prior 3 months OR consuming a monthly Ethinyl Estradiol (EE)-containing OC pill for at least 3 months prior to study entry; nulliparous and non-pregnant; non-smoker; and otherwise healthy.
Participants were excluded for the following: involvement in consistent, structured resistance training or progressive, intensive aerobic training within 6 months prior to study entry or throughout study completion; muscular, neurological, or skeletal disorders capable of influencing leg performance; history of high blood pressure (systolic ≥ 140 mmHg or diastolic ≥90 mmHg) or heart disease; acute infections, recent surgery, trauma, or illness preventing resistance exercise; use of anti-coagulator or anti-inflammatory medications; undergoing dietary intervention; current use of cardiac pacemaker; epilepsy; or lacking normal skin sensation.
Study design
Three groups underwent a single intense quadriceps-targeting NMES bout. Participants were randomized into: “HI”, non-contraceptive users underwent NMES during the luteal phase; “LO”, non-contraceptive users performing NMES during the menstrual phase; “OC”, contraceptive users performing NMES during active pill consumption (midcycle). Cycle day 1 began with the start of menses for LO and HI and began on the first day of pill consumption for OC; HI participants self-reported normal (28-32 days) monthly menstrual cycles. A negative pregnancy test was confirmed before undergoing any test procedures.
Participants underwent an NMES screening session during Visit 1 (7-10 days before the NMES bout on Visit 2) where they completed a 3-days dietary recall and a 7-days physical activity recall, performed body composition estimation (detailed below), and screening for eligibility to undergo NMES.
Maximum voluntary isometric contraction (MVIC) was established and followed by NMES screening which consisted of 30 repetitions on the left leg extensors with parameters as described below. Eligibility was determined by the ability to achieve an electrically-induced force output of ≥ 15% of the force achieved during MVIC. Visit 2 occurred during menses for LO, mid-luteal phase for HI, or mid-cycle for OC.
A negative pregnancy test was confirmed before obtaining a baseline blood sample and muscle biopsy sample. Participants were allowed 10-15 minutes of rest after the muscle biopsy and then underwent the NMES bout as described below. Participants returned later for the 2-hour post-NMES muscle biopsy.
Body composition
Body composition was estimated with the Biospace Co. Ltd (Seoul, Korea) full body multi-frequency bioelectrical impedance analysis InBody 720 device. This device utilizes a patented 8-point tactile electrode system established by standing on and gripping the electrodes. This device uses 3 frequencies (5 kHz, 50 kHz, and 500 kHz), producing a total of 30 impedance values for 5 body segments, to estimate composition using proprietary equations.
Blood draw and analysis
Venous blood was collected from the antecubital vein by a certified phlebotomist using standard sterile procedures. Blood was collected in EDTA-containing vacuum tubes which were inverted 8-10 times and centrifuged for 10 minutes. Plasma was then aliquoted for storage at -80o until further analysis. 17-β estradiol (E2) was measured with the Estradiol Parameter Assay Kit (R and D Systems, Cat #KGE014) by the USC Diabetes and Obesity Research Institute Metabolic Assay Core. Intra- and inter-assay Coefficients Of Variation (CV) were 6.0% and 7.1%, respectively.
Muscle biopsy
Percutaneous muscle biopsy samples (150 mg-200 mg), performed by a licensed physician, was obtained from the mid-portion of the vastus lateralis of the left leg within 30 minutes before and 2-hours after NMES. Biopsy specimens were collected under sterile conditions and local anesthesia (1% lidocaine; topical and subcutaneous) with a 5 mm Stille biopsy needle (Micrins Surgical, Lake Forest, IL), inserting the needle slightly laterally.
Post-NMES biopsies were performed through the same incision site as the pre-biopsy, inserting the needle slightly medially. Muscle samples were immediately rinsed with sterile saline then flash-frozen in liquid nitrogen and stored at -80°C until processed for analysis.
Statistics
Values throughout are given as means and standard deviations ( ± SD). Student t-test was used when comparing means. Pearson’s correlation coefficient (rp) was used to analyse interrelationships between variables. Stepwise multiple linear regression analyses, both backward and forward, were performed to discover explanatory indices of mean power during paddling on a kayak-ergometer.
In the backward regression, independent variables were excluded due to co-linearity during the multiple regression analysis. When no co-linearity was found between independent variables, a forward regression analysis was performed. Power was the dependent variable while VO2 peak, paddle forces, pulling forces and pushing forces were the independent ones. The mean values of left and right forces were used in the multiple linear regression analyses. Multiple regression models are reported together with the adjusted R2 values as assessments of the goodness-of-fit. SPSS (Version 13.0, SPSS Inc. Chicago, Illinos, USA) was used for the statistical analyses. The p<0.05 criterion was used for establishing statistical significance.
Neuromuscular electrical stimulation
NMES was administered on the left knee extensors using the FastStart® EMS (VisionQuest Industries, Inc. © 2006, Irvine, CA) neuromuscular stimulator. The left leg was the non-dominant leg for all but one participant. Participants were seated on an upright weight bench at ~90° knee flexion. Two parallel electrode channels (7.5 × 13)cm were used to conduct the stimulation cutaneously; one electrode from each channel was placed proximally on the quadriceps, the other placed distally.
100 contractions were performed using a symmetric biphasic square wave, 80 pps frequency, 300 μs phase duration, 5:10s on:off time; 1.5s ramp-up. The amplitude was increased throughout the 100 contractions according to the participant’s maximal tolerance in order to achieve and/or maintain ≥ 25% MVIC throughout each contraction.
qRT-PCR
Skeletal muscle was homogenized in TRIzol® (ThermoFisher Scientific) using the TissueLyzer II (Qiagen) per manufacturers’ protocols. 500 ng of purified RNA was reverse transcribed into cDNA using SuperScript® III First- Strand Synthesis SuperMix (ThermoFisher Scientific). Quantitative real-time PCR was performed using Power SYBR® Green PCR Master Mix or TaqMan® Universal Master Mix II (ThermoFisher Scientific).
Taqman gene expression assay for FOXO3 was ordered from ThermoFisher Scientific (Catalog Number 4453320). Other primer sequences are listed in Table 1. qRT-PCR assays were run using the 7900HT Fast Real-Time PCR System from Applied Biosystems. Standard curves were used for quantitation. All gene expression was normalized to housekeeping gene 36B4.
| Gene | GeneBank ID | Direction | Sequence |
|---|---|---|---|
| 36B4 | NM_001002.3 | For | CCACGCTGCTGAACATGCT |
| Rev | TCGAACACCTGCTGGATGAC | ||
| ERa | NM_000125.3 | For | TTACTGACCAACCTGGCAGA |
| Rev | TTACTGACCAACCTGGCAGA | ||
| Gpx3 | NM_002084.3 | For | GGGGACAAGAGAAGTCGAAGA |
| Rev | GGGGACAAGAGAAGTCGAAGA | ||
| IL-6 | NM_000600.3 | For | CTTGACCTCTAAAAACGGATTCA |
| Rev | CTGCAGCCACTGGTTCTGT | ||
| TNFa | NM_000594.2 | For | CAGCCTCTTCTCCTTCCTGAT |
| Rev | GCCAGAGGGCTGATTAGAGA | ||
| Mstn | NM_005259.2 | For | TGGTCATGATCTTGCTGTAACC |
| Rev | CTTGACCTCTAAAAACGGATTCA | ||
| MAFbx | NM_058229.3 | For | GCAGCAGCTGAACAACATTC |
| Rev | CACAAAGGCAGGTCAGTGAA | ||
| MuRF-1 | NM_032588.3 | For | GTGTGCAGACCATCATCACTC |
| Rev | GTGTGCAGACCATCATCACTC | ||
| MyoD | NM_002478.4 | For | CACTACAGCGGCGACTCC |
| Rev | TAGGCGCCTTCGTAGCAG |
Table 1: Sequences of primers used in qRT-PCR.
Immunoblot analysis
Muscle was homogenized on ice using a motorized Teflon pestle in Tris-triton buffer (10 mM Tris-pH 7.4, 100 mM NaCl, 1 mM EDTA, 1 mM EGTA, 1% Triton X-100, 10% glycerol, 0.1% SDS, and 0.5% deoxycholate) containing 1X complete Protease Inhibitor Cocktail (Roche), 1X PhosSTOP (Roche), and 1 mM phenylmethylsulfonyl fluoride. Protein concentration was determined using the DCTM Protein Assay (Bio-Rad). 30 mcg of protein lysate was loaded onto Bolt 4-12% Bis-Tris Plus Gels. Immunoblot was blocked in 5% milk/TBS. FoxO3a and phosphor- FoxO3a (Thr32) antibodies were both purchased from Cell Signaling Technology and used at 1:1,000 in 5% BSA (CS2497 and CS9464, respectively). Beta(β)-actin antibody was used at 1:10,000 (Sigma A2066).
HRP-goat anti-rabbit antibody (Invitrogen 656120) was used at 1: 4,000. Antibody binding was detected by Pierce ECL 2 Western Blotting Substrate (ThermoFisher Scientific), using ImageQuant LAS4000 (GE) for image capture. Fiji software was used for quantification of band intensity. Phosphorylated (P) and total (T) FOXO3a bands were normalized to β-actin to standardize loading.
Statistical analysis
All data are expressed as Mean ± SD (Tables and text) or Mean ± SEM (Figures) and were analyzed using PASW Version 18.0 (Chicago, IL). One-Way ANOVA with Tukey post-hoc pair wise comparison was used to compare baseline measures and fold changes scores between group means. Paired-sample t-tests were used to compare pre to post-NMES mRNA and protein expression levels. Statistical significance was accepted as p ≤ 0.05.
Due to the small sample size, we also present the ES for examination of trends that may not be revealed through ANOVA and t-tests which require large samples sizes. Effect sizes for within-group comparisons were calculated as the change score divided by the baseline standard deviation. Effect sizes for between-group comparisons were calculated pair-wise as the difference between fold changes scores divided by the pooled standard deviation. Ranges for absolute values of ES were: 0.0-0.6 (small), 0.6-1.2 (moderate), 1.2-2.0 (large), 2.0-4.0 (very large) [45].
For between-group comparisons, a positive ES indicates the experimental group had a larger value than the control group and a negative ES indicates the experimental group had a smaller value than the control group (i.e. ES for LO vs. HI = 2.0 means value for HI was larger than the value for LO). For within-group comparisons, a positive ES indicates an increase from pre- to post-NMES and a negative ES indicates a decrease from pre- to post-NMES.
Power analyses were conducted with SigmaStat version 3.5 (Germany) using a 3-group ANOVA, 80% power, and a 0.05 two-sided significance level for change in systemic IL-6 levels which was an endpoint in the primary analyses of this study [46]. A sample size of 7 would have 80% power to detect a between-group difference of 1.8 pg/ml in mean change of systemic IL-6 levels assuming a common standard deviation of 1.0 pg/ml.
Participant characteristics
After recruitment was completed (N=26 total) for the primary study aim [46], three women completed muscle biopsies in each group. There were no statistically significant between-group differences in mean baseline characteristics, diet recall, or physical activity recall (Table 2). OC ingested the OC pill 1.0 ± 0.3 hours before the resting blood draw to ensure high systemic hormone levels throughout NMES.
| LO (N=3) | HI (N=3) | OC (N=3) | ||||
|---|---|---|---|---|---|---|
| Mean | SD | Mean | SD | Mean | SD | |
| Characteristics | ||||||
| Age (years) | 25 | 4 | 24 | 1 | 25 | 4 |
| Body Weight (kg) | 65.5 | 4.5 | 56.2 | 3.6 | 62.9 | 10.1 |
| Lean Mass (kg) | 46.2 | 5.0 | 41.4 | 4.7 | 46.1 | 5.6 |
| Fat Mass (kg) | 17.6 | 7.0 | 14.7 | 2.7 | 16.8 | 5.8 |
| Body Fat (%) | 26.7 | 9.0 | 26.5 | 5.1 | 26.3 | 5.4 |
| BMI (kg/m2) | 24.8 | 3.2 | 22.4 | 1.3 | 22.8 | 2.3 |
| Diet Recall | ||||||
| Carbohydratesa | 227.5 | 74.3 | 204.7 | 35.7 | 213.6 | 26.5 |
| Fata | 57.3 | 23.5 | 50.3 | 27.0 | 69.9 | 12.2 |
| Proteina | 81.2 | 21.7 | 55.7 | 4.9 | 77.0 | 10.7 |
| Kcal/day | 1842 | 518 | 1568 | 309 | 1794 | 62 |
| Physical Activity Recallb | ||||||
| Moderate | 1.8 | 0.9 | 1.6 | 1.8 | 2.8 | 2.5 |
| Hard | 1.3 | 0.7 | 0.3 | 0.5 | 1.3 | 0.6 |
| Very Hard | 0.3 | 0.4 | 0.0 | 0.0 | 0.2 | 0.3 |
| Total | 3.3 | 0.8 | 1.9 | 1.7 | 4.3 | 1.6 |
| Menstrual Cycle | ||||||
| 17-β Estradiol (pg/ml)* | 70.3 | 19.2 | 123.6 | 41.6 | 44.0 | 25.0 |
| Menstrual cycle day** | 2 | 1 | 24 | 5 | 15 | 4 |
| agrams/day; bhours/week; One-Way ANOVA **p=0.001, *p=0.05 | ||||||
Table 2: Participant descriptives.
Menstrual cycle day on Visit 2 was indicative of menses for LO, luteal phase for HI, and pill consumption for OC (Table 2). Mean systemic E2 was indicative of menses for LO, luteal phase for HI, and ovarian suppression of E2 in OC (Table 2). Mean E2 was statistically significantly different between HI and OC only (Tukey post-hoc p=0.04).
Between-groups comparison of resting values
ES of the group comparisons indicated some trends for mRNA expression. LO trended toward the lowest levels of ERα and trended towards the highest levels of the antioxidant Gpx3 (Table 3). OC trended toward the lowest levels of Gpx3 and MyoD and trended toward the highest levels of ERα, Mstn, and MAFbx (Table 3).
| Gene | LO vs. HI | LO vs. OC | HI vs. OC |
|---|---|---|---|
| mRNA | |||
| ERα | 2.14** | 3.50** | 2.33** |
| Gpx3 | -1.28* | -2.03** | -1.40* |
| IL-6 | 0.00 | 0.00 | 0.00 |
| TNF-α | -0.06 | -0.41 | -0.46 |
| Mstn | -0.41 | 3.16** | 4.82** |
| FOXO3a | 4.56** | 1.72* | -4.04** |
| MAFbx | 0.43 | 2.94** | 2.88** |
| MuRF-1 | 1.19* | 2.00* | 1.31* |
| MyoD | 0.54 | -0.95 | -4.31** |
| Protein | |||
| T-FOXO3aƚ | 0.78 | 0.70 | -0.16 |
| P-FOXO3a | 0.62 | 0.34 | -0.10 |
| P-FOXO3a/T-FOXO3aǂ | -0.81 | -0.96 | 0.05 |
| *Large or **Very Large effect size; One-Way ANOVA ƚp=0.09 or ǂp=0.03. | |||
Table 3: Effect sizes of baseline between-group comparisons.
HI trended toward the highest levels of FOXO3a (Table 3). There were no statistically significant between-group differences in any mRNA comparison at rest.
For protein levels, LO trended toward lowest levels of T-FOXO3a (Figure 1; Tukey post-hoc: LO vs. HI, p=0.09). LO displayed statistically significantly higher P-FOXO3a/T-FOXO3a ratio than HI or OC (Figure 1; Tukey post-hoc: LO vs. HI, p=0.04; LO vs. OC, p=0.04).
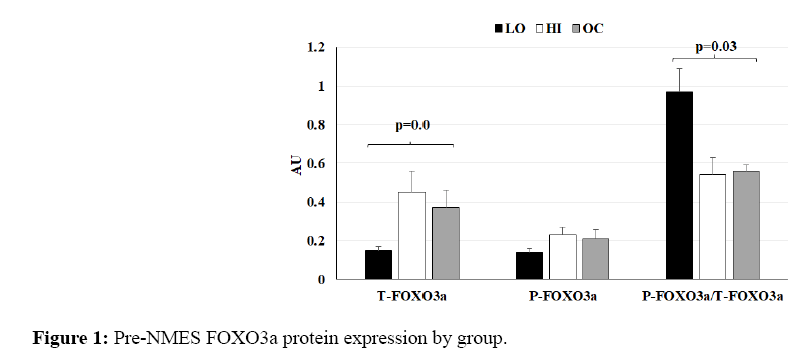
Figure 1: Pre-NMES FOXO3a protein expression by group.
There were no statistically significant differences between HI and OC for T-FOXO3a, P-FOXO3a, or their ratio. However, there may be a parallel between the pattern of increased FOXO3a mRNA and greater T-FOXO3a protein expression during HI compared to LO.
AU=Arbitrary Units. Resting phosphorylated (P) and total (T)-FOXO3a protein levels and their ratio relative to β- actin expression. Bars represent LO (black), HI (white), and OC (gray).
Within-group changes after NMES
For the antioxidant gene Gpx3 (Figure 2a), ES of within-group changes were very large for HI (3.05) and OC (2.22) and Small for LO (0.29); there were no statistically significant within-group changes. For the inflammatory gene IL-6, ES of within-group change was Very Large for LO (8331.55), HI (3454.84), and OC (3848.90); changes were statistically significant for LO (p=0.01) and HI (p=0.03) and trended for OC (p=0.08; Figure 2b).
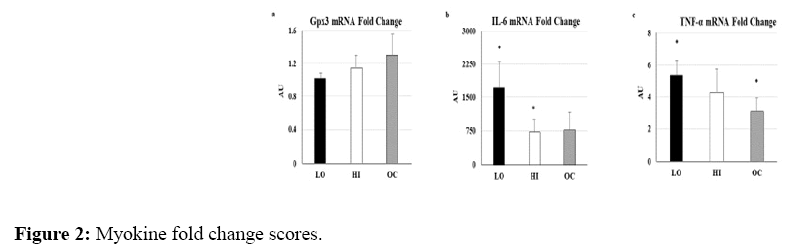
Figure 2: Myokine fold change scores.
For the inflammatory gene TNF-α, ES of within-group changes were very large for LO (14.29), HI (16.53), and OC (28.48); changes were statistically significant for LO (p=0.05) and OC (p=0.02; Figure 2c).
AU=Arbitrary Units. mRNA fold change scores for a) Gpx3, b) IL-6, and c) TNF-α normalized to pre-NMES levels and 36B4 expression. Bars represent LO (black), HI (white), and OC (gray). *within group change p<0.05.
For the atrogene Mstn, ES of within-group changes were very large for LO (-2.73), HI (-4.43), and OC (-3.12); changes trended for statistical significance in HI (p=0.08; Figure 3). For the atrogene FOXO3a, ES of within-group changes were very large for LO (-2.44), HI (-5.62), and OC (-4.68); changes were statistically significant for HI (p=0.04) and trended toward statistical significance in OC (p=0.08; Figure 3).
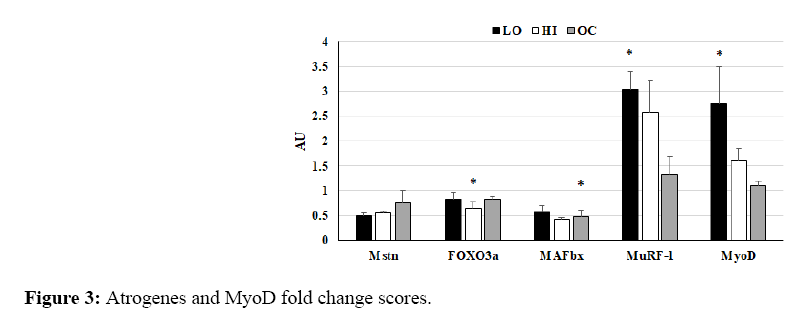
Figure 3: Atrogenes and MyoD fold change scores.
For the atrogene MAFbx, ES of within-group changes were very large for LO (-2.85), HI (-4.58), and OC (-6.15); changes were statistically significant for OC (p=0.03) and trended toward statistical significance in HI (p=0.06).
AU=Arbitrary Units. mRNA fold change scores for a) atrogenes Mstn, FOXO3a, MAFbx, and MuRF-1, and b) MyoD normalized to pre-NMES levels and 36B4 expression. Bars represent LO (black), HI (white), and OC (gray). *within group change p<0.05.
For the atrogene MuRF-1, ES of within-group changes were Very Large for LO (30.44), HI (24.18), and OC (2.32); changes were statistically significant for LO (p=0.01) and trended toward statistical significance for HI (p=0.08). For the myogene MyoD, ES of within-group changes were Very Large for LO (6.85) and HI (14.74); changes were statistically significant for LO (p=0.03). There were no Very Large ES or statistically significant within-group changes for any group for T-FOXO3a, P-FOXO3a, or P-FOXO3a/T-FOXO3a ratio; the decrease in HI trended toward statistical significance (p=0.07) for P-FOXO3a.
Between-group changes after NMES
The greatest increases in IL-6, TNF-α, MuRF-1, and MyoD were observed in LO, indicated by ES group comparisons (Table 4) and fold changes (Figure 2-3). There was a trend for statistical significance between-groups for MyoD (One-Way ANOVA, p=0.10) comparison of LO vs. OC (Tukey post hoc, p=0.09). Mstn appeared to decrease similarly in LO and HI, indicated by ES group comparisons (Table 4) and fold changes (Figure 3). FOXO3a decreased in HI only, along with a trend for decreased MAFbx in HI and a significant decrease in OC, indicated by ES group comparisons (Table 4) and fold changes (Figure 3). There were no statistically significant between-group fold change comparisons for Gpx3, IL-6, TNF-α, Mstn, FOXO3a, MAFbx, or MuRF-1. There were no meaningful ES (Table 4) or statistical significance of any between-group comparison for T-FOXO3a, P-FOXO3a, or the PFOXO3a/ T-FOXO3a ratio. Figure 4 displays a representative Western Blot of the FOXO3a proteins.
| Gene | LO vs. HI | LO vs. OC | HI vs. OC |
|---|---|---|---|
| mRNA | |||
| Gpx3 | 2.09** | 2.75** | 1.29* |
| IL-6 | -3.77** | -3.30** | 0.21 |
| TNF-α | -1.51* | -4.43** | -1.80* |
| Mstn | 1.59* | 2.23** | 1.85* |
| FOXO3a | -2.42** | 0.07 | 3.45** |
| MAFbx | -2.77** | -1.22* | 1.26* |
| MuRF1 | -1.45* | -7.90** | -4.09** |
| MyoD | -3.61** | -5.45** | -5.03** |
| Protein | |||
| T-FOXO3a | -0.08 | 0.27 | 0.31 |
| P-FOXO3a | -0.62 | 0.40 | 0.51 |
| P-FOXO3a/T-FOXO3a | 0.06 | -0.08 | -0.12 |
| *Large or **Very Large effect size | |||
Table 4: Effect sizes of fold change score comparisons between groups.
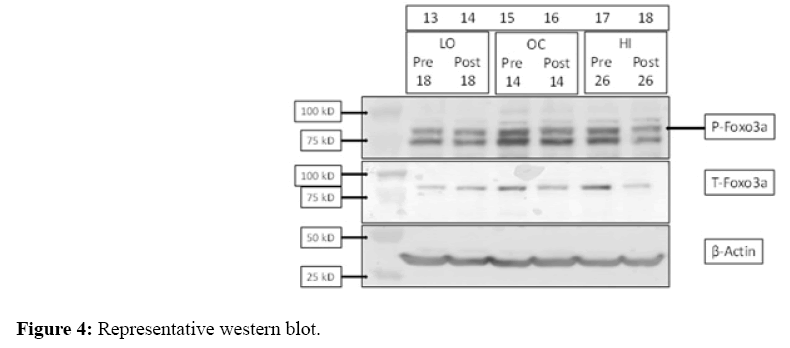
Figure 4: Representative western blot.
Representative image of typical immunoblot results for FOXO3a protein loading and detection using three participant samples pre- and post-NMES. Molecular weight is displayed by kD (kilodalton) on the left, β-actin was used for normalization.
This is the first study to the authors’ knowledge to report the myokine and atrogene mRNA response or FOXO protein response after acute muscle damage in young women. The main finding from this study was the greater inflammatory responses in LO compared to HI or OC. This finding suggests an estrogen related reduction in acute contraction-induced muscle inflammation after NMES. An additional interesting finding was the robust MyoD response in LO which may have been directly related to the large inflammatory response in that group. In contrast, there was not an apparent trend for an estrogen related influence on the acute catabolic response to NMES. As expected, mean E2 levels were similar for LO and OC, consistent with active menstruation in LO and ovarian E2 suppression in OC. Mean E2 levels in HI were expected to be significantly higher than both OC and LO but were only statistically significantly higher than OC. Mean E2 levels in HI were slightly lower than the average (~200 pg/ml) for the mid-luteal phase [47]. This is likely due to the small sample size and high inter-individual variation in E2 fluctuation during ovulation. However, basal ERα levels appeared to be sensitive to variations in the menstrual cycle and OC use with the lowest levels being expressed during menses.
The antioxidant Gpx3 is a glutathione peroxidase shown to be sensitive to circulating E2 levels and is partly regulated by ERα in mice, with skeletal muscle Gpx3 decreasing after ovariectomy and increasing with acute or chronic E2 treatment [48]. In contrast, Rush et al. did not find an association between circulating E2 and circulating Gpx3 levels in young women [49]; however, circulating Gpx3 was not measured here. Basal Gpx3 expression in quadriceps muscle was higher during menses than during the luteal phase or OC use in the current study, suggesting a potential intramuscular Gpx3 sensitivity to E2 in young women opposite to that reported in mice [48]. Rush et al. reported no change in serum Gpx3 after 90 minutes of moderate intensity cycling [49]. The current study reports a possible NMES-induced muscular Gpx3 increase in OC with no change in HI or LO, which may indicate an effect of the estradiol component in OC preparations. Similarly, the greater increases in IL-6 and TNF-α after NMES in LO compared to HI and OC observed here are consistent with the hypothesis that estrogen may help reduce muscle damage after exercise. This observation may be due to an anti-inflammatory influence of higher total estrogen exposure during the luteal phase or OC consumption. This is the first study to date to report the myokine response to muscle damage after NMES in young women; however, these results are consistent with another report of an estrogen related attenuation of myokines after acute muscle damage in postmenopausal women using estrogen-based HT [34].
Previous studies have reported a reduction in Mstn protein 1 hour after resistance exercise in healthy men [50] and 2 hours after NMES in diabetic elderly men [51]. This early reduction in expression may serve to promote satellite cell activation and reduce Akt inhibition after muscle damage. Here, Mstn decreased after NMES in all groups with the greatest decreases in LO and HI. These data are in contrast with another report of greater Mstn suppression after acute muscle damage in postmenopausal women using HT [35]. While Mstn decreases were expected, the current observations do not directly support the hypothesis that estrogen may help reduce muscle damage after exercise because the greatest reductions were not seen in HI and OC. These observations suggest that OC use may attenuate Mstn suppression after exercise, which may limit the satellite cell regenerative response during OC use. However, this reduced response may be due to the elevated resting Mstn in OC reported here.
The acute exercise response of FOXO3a and its downstream ligases MAFbx and MuRF-1 are not well characterized. It was expected that expression of these atrogenes would increase acutely after muscle damage. In contrast, FOXO3a decreased in all groups with the greatest decreases in HI, which partially supports the hypothesis that estrogen may help reduce muscle damage. However, there was a similar decrease in LO and OC, suggesting that ethinyl estradiol is not as effective as E2 in suppressing FOXO3a after muscle damage. This suggestion is also supported by elevated basal FOXO3a in HI. Similarly, resting MAFbx was elevated in OC, which may suggest an influence of ethinyl estradiol on basal MAFbx. However, in concert with FOXO3a, MAFbx decreased in all groups after NMES with the greatest decreases in HI and OC. Consistent with a previous report of protein expression after resistance exercise [52], MuRF-1 increased after NMES in all groups. MuRF-1 displayed a negative relationship between resting levels and NMES-induced fold change with LO displaying the lowest resting levels and largest increase after NMES and OC displaying the opposite pattern. These results are consistent with Wall et al., which reported MAFbx decreased and MuRF-1 increased 2 hours after NMES, although neither fold change was statistically significant [51]. The current observations of greater reductions of MAFbx and smaller increases in MuRF-1 in HI and OC both support the hypothesis that estrogen may help reduce muscle damage after exercise.
E2 treatment has reportedly increased MyoD total RNA expression in mice [53]. There was a trend for increased resting MyoD in HI vs. OC in the current study, with large variability in LO, which does not support an estrogen influence on basal MyoD expression. After NMES, MyoD increased in LO and HI, with the greatest increases in LO, and no change in OC. These data are consistent with Wall et al. who reported increased MyoD after NMES [51] but in contrast to Dieli-Conwright et al. who reported increased basal MyoD and a greater MyoD response after acute voluntary exercise in HT users [54]. However, as it is generally thought that the inflammatory response to muscle damage plays a role in triggering the subsequent regenerative response, this blunted myogenic response may be explained by the blunted inflammatory response in HI and OC.
As there is limited interpretation available from acute mRNA responses, T-FOXO3a and P-FOXO3a protein levels were also examined. At rest, T-FOXO3a was moderately less in LO than HI or OC but P-FOXO3a was similar across groups, making the ratio of P-FOXO3a/T-FOXO3a moderately greater in LO than HI or OC. The majority of FOXO3a content in LO being inactive is contrary to the current hypothesis of an estrogen related reduction in the catabolic environment. Both T-FOXO3a and P-FOXO3a moderately decreased after NMES in LO and HI and increased in OC. However, these results are consistent with decreased FOXO3a after NMES for HI.
Interpretation of this data is limited by the very small sample size, inclusion of only one post-NMES time point for muscle biopsy, inclusion of only one protein measure, and use of an involuntary exercise model. By targeting the peripheral nervous system, use of NMES may circumvent psychological inhibition often limiting participants from providing maximal effort with conventional exercise. However, it appears that the 2-hour post-NMES time point in isolation is not sufficient to observe the Mstn/Akt/FOXO dynamics in response to acute exercise. Assessment of Mstn and other catabolic proteins at additional time points would likely provide meaningful information on the paradigm of these actors in response to acute muscle damage. Future analysis of the estrogen influence on MAPK activation in young women may also shed light into the relationship between estrogen and skeletal muscle as E2 treatment previously reduced oxidative stress-induced apoptosis of C2C12 cells [55].
In light of these considerations, there were blunted inflammatory and myogenic mRNA responses and an improved anti-inflammatory mRNA response after NMES during the luteal phase and during OC consumption compared to during menses. These responses are consistent with the hypothesis that muscle damage is blunted during high estrogen environments. The responses of MAFbx and MuRF-1 are also suggestive of the potential for greater muscle damage during menses. However, OC users may experience an increased resting catabolic environment due to elevated basal Mstn, MAFbx, and MuRF-1 during OC consumption than non-OC users.
The authors would like to extend great appreciation to Dr. Andres Gonzalez for performing the muscle biopsies.