Research Article - Annals of Biological Research ( 2019) Volume 10, Issue 1
Diabetes mellitus is a syndrome characterized by chronic hyperglycemia and disturbances of carbohydrate, fat and protein metabolism associated with an absolute or relative deficiency in insulin secretion or insulin action. To investigate the effect of white grub extract on alloxan-induced diabetic rats. Diabetes was induced in rats after 18 hours of fasting intraperitoneally by alloxan (80 mg/kg). A total of 40 rats used, were divided into eight groups (G1- GVIII) of five rats each. GII-GVIII were induced with diabetes. GI served as normal control, GII were administered only distilled water and GIII were administered the standard anti-diabetic drug (Glibenclamide ‘5 mg’). While GIV (E2, 100 mg/kg), GV (E3, 200 mg/kg), GVI (E4, 300 mg/kg), GVII (F1, 400 mg/kg) and GVIII (F2, 500 mg/kg) were respectively administered with fraction of white grub extracts. After fifteen (15) days of oral administration of the extracts, the animals were sacrificed and the serum was collected for analysis of lipid profile (Total Cholesterol ‘TC’, Low Density Lipoprotein-Cholesterol ‘LDL-C’, High Density Lipoprotein-Cholesterol ‘HDL-C’, Very Low Density Lipoprotein ‘VLDL’ and Triglycerides ‘TG’). Significant decrease (P<0.05) in the serum TC, LDL-C, HLDL-C, for GIV, GV, GVI, GVII, and GVIII and TG, VLDL, for GIV and GVI, and significant increase (P<0.05) in the TG and VLDL for GIV, GVI, and GVIII levels were observed in diabetic treated groups when compared with diabetic untreated group (GII), while GVIII show normal HDL-C level which is comparable to normal control group. The Group (GVIII) also show a Significant increase in TC, TG, VLDL, and LDL-C and a significant decrease in HDL-C when compared to the GIII treated with the standard drug. Percentage increase and decreased blood glucose (BG) levels and lipid profile were evaluated for fifteen days of oral administration of the extracts. The Fourier Transform Infrared (FTIR) analysis of the most active extract shows that the compounds may contain the functional groups like –OH, Nitro, -COOH, an aromatic ring, and others, while it's Gas chromatography-Mass spectroscopy (GC-MS) analysis may contain Urea, Fatty acids and carbohydrate among others. This result shows a positive curative effect of the white grub extracts in the management of Diabetes mellitus (DM) and lipid abnormalities may be associated with the presence of the compounds.
Diabetes mellitus; Alloxan; White grubs; Humic substances; lipoproteins.
White Grubs are the larvae of certain beetles, such as June beetles and chafers, found in the genus Phyllophagaephilida species, of which there are over 100 different species. The Phyllophagaephilida larvae and other larvae of the family Scorabacidea are often referred to as “white Grubs.” Phyllophagaephilida species and other related insects are distributed throughout the United States and Canada [1]. In Africa, the species of Phyllophagaephilida is widely distributed and was found in Nigeria, Niger Republic, Uganda etc., [2]. In Northern Nigeria, white grubs among Hausa-Fulani is called “Gwazarma or Dole-dole” and is used in the treatment of jaundice, fever, and general body weakness, and as a food ingredient by various communities [2]. Most tissues and organs, such as the brain, need glucose constantly, as an important source of energy. Low blood concentrations of glucose can causes seizures, loss of consciousness, and death. On the other hand, long-lasting elevation of blood glucose concentrations can result in blindness, renal failure, vascular disease, and neuropathy [3]. Diabetes mellitus is a group of metabolic diseases characterized by elevated blood glucose levels (hyperglycemia) resulting from defects in insulin secretion by beta cells of the pancreas. Approximately 7.1 million Africans by the year 2000 were reported to be suffering from DM with the figure expected to rise further to 18.6 million by 2030 [4]. Nigeria is the most populous nation in Africa and the 7th most populous nation on earth. Current approximate population is 170 million and counting, with 76 million adults and 3.1 million people with DM [5,6]. International Diabetes Federation (IDF) 2010 reported a prevalence estimate of 3.9% for Nigeria [7] and the current prevalence of 4.9% is more than double the previous national prevalence of 2.2% [8], following the landmark Federal Ministry of Health co-ordinated National Survey of 1997. Most data available for diabetes prevalence in Nigeria are based on the standardized 1985 WHO Criteria [9]. Reports based on the more current 1999 WHO and the 2003 American Diabetes Association (ADA) criteria are very limited. However, with the increasing incidence of childhood obesity and concurrent insulin resistance, the number of children diagnosed with type 2 diabetes has also increased worldwide [10]. Diabetes mellitus has been considered as one of the major health concerns all around the world today [11].
Sample collection and identification
White Grubs used as a sample were collected by hand picking at dump site in kwalam village, Taura Local Government, Jigawa State. They were authenticated at the Department of Biochemistry, Bayero University Kano by Mrs. Aisha Isyaku Kiru.
Sample preparation
Whole white Grubs were cleaned of dirt and blot, and were oven dried for six hours at 80ᵒC before been ground to powder and kept in a plastic container at room temperature (Figure 1).
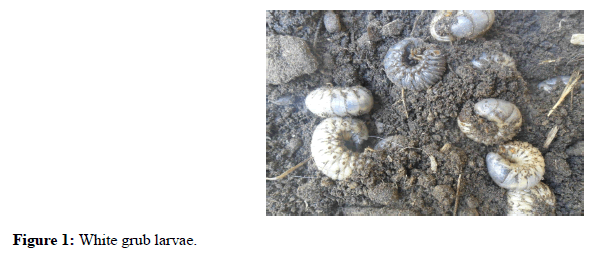
Figure 1: White grub larvae.
Extract preparation
A clean weighed whole white Grub was squeezed to release the extract (Grubs’ extract). The extract was filtered using cheesecloth into a measuring cylinder. The residue was weighed and the difference between the extract weight and initial weight of the Grubs gives the weight of the known volume of the extract. The concentration of the extract was found to be 0.538 g/cm3.
Analysis
Humic Substances from the White Grubs sample were analyzed as described by isolation [12-14].
Experimental animals
For alloxan-induced diabetes, forty (40) albino rats of either sex weighed of 60 g to 120 g were purchased. The animals were kept in wire mesh cages at the animal house and were grouped into five, each cage contain five rats. All the animals were acclimatized for two weeks, allowed free access to food and water and maintained on animal feeds. Each group was treated as follows:
• Group I: Control rats administered only distilled water
• Group II: Diabetic control rats administered only distilled water
• Group III: Diabetic control rats administered Glibenclamide (5 mg/kg)
• Group IV: Diabetic rats administered orally with Fulvic acid extract ‘E2’ (100 mg/kg)
• Group V: Diabetic rats administered orally with Humic acid extract ‘E3’ (200 mg/kg)
• Group VI: Diabetic rats administered orally with Humin extract ‘E4’ (300 mg/kg)
• Group VII: Diabetic rats administered orally with Crude methanol extract ‘F1’ (400 mg/kg)
• Group VIII: Diabetic rats administered orally with chloroform extract ‘F2’ (500 mg/kg)
The rats were treated as such for 15 days; glucose level was measured on day 1, day 2, day 5, day 10, and day 15. At the end of the experiment, animals from each group were sacrificed by cervical dislocation for estimation of total lipids profile (i.e., total cholesterol, triglyceride, LDL, HDL and VLDL levels). Blood was collected from the heart and allowed to clot and the serum was separated by centrifugation at 3500 rpm for 10 min. Serum was assayed immediately.
Induction of diabetes by alloxan
Diabetes was induced in rats by a single Intraperitoneal (I.P.) injection of a freshly prepared solution of Alloxanmonohydrate (80 mg/kg) after 18 hours of fasting. The blood glucose level was monitored after alloxanization and blood samples collected by tail tipping method using a Glucometer. Twenty-four hours later rats with blood glucose concentrations above 190 mg/dL were considered diabetic and 40 of such rats were used for the study [15].
Estimation of glucose levels
Serum glucose was estimated by glucose oxidase method using Randox kit [16].
Estimation of serum lipid profile levels
Serum Total Cholesterol (TC) [17], High-Density Lipoprotein Cholesterol (HDL-C) [18] and Triglycerides (TAG) [19] were quantified by an enzymatic method using Randox kit. LDL-C and VLDL-C were calculated using friedewald formula [20],
• LDL-C (mmol/l)=TC- (HDL-C)-TG/2.2
• VLDL-C (mmol/l)=TG/2.2
The atherogenic index was calculated using the formula as described by [21].
• Atherogenic index (AI)=Total cholesterol-HDL Cholesterol/HDL Cholesterol
Percentage increases or decrease were calculated using the relation:
• %=Xs-Cv/Cv × 100 [22].
Where, Xs=Sample value, Cv=Reference value (Normal control or Diabetic untreated group).
The Statistical Package for Social Sciences (SPSS) Computer software version 16 was used for data analysis. The results were expressed as mean ± standard deviation (S.D) with the results analyzed by using one-way analysis of variance (ANOVA). Post-Hoc Dunnett’s-test at 95% level of significance was used to assess the significant difference between the control and treated groups. P<0.05 was considered to be statistically significant.
Serum glucose level
Table 1 shows the effect of white Grub extracts on fasting blood glucose (FBG) level were measured on 5th, 10th and 15th day of post induction and compared with normal and diabetic control groups. The values are shown in Table 1. Alloxan-induced rats showed a significant increase (P<0.05) in the FBG level compared to normal rats. Oral administration of white Grub extract at the dose of 100 mg/dl and 200 mg/dl body weight showed a normal FBG level on a 15th day when compared with the normal control, while at the dose of 300, 400 and 500 mg/kg showed a significant increase (P<0.05). The group orally administered glibenclamide 5 mg/kg body weight showed a normal glucose level.
| Group Treatment | Before Induction | 24 hrs After Induction | 5th Day After Induction and Extract Administered | 10th Day Extract After Induction and Administered | 15th Day after induction and extract administered |
|---|---|---|---|---|---|
| GI Normal control | 50.60 ± 17.83a | 80.00 ± 11.56a | 91.20 ± 10.95a | 101.60 ± 18.72a | 127.05 ± 15.52a |
| GII Diabetic control | 71.60 ± 7.84b | 288.6 ± 27.91b | 292.00 ± 16.82b | 298.60 ± 28.28b | 310.00 ± 19.22b |
| GIII Glibenclamide 5 mg/kg b.w | 96.00 ± 4.94c | 237.8 ± 15.94c | 167.20 ± 16.18c | 100.00 ± 14.86c | 69.01 ± 2.01c |
| GIV E2 100 mg/kg b.w | 90.00 ± 8.54c | 267.6 ± 42.22bc | 180.60 ± 13.63c | 107.00 ± 7.74ab | 70.40 ± 8.05c |
| GV E3 200 mg/kg b.w | 88.80 ± 17.46 | 200 ± 8.24bc | 179.80 ± 22.39c | 138.60 ± 16.06ab | 102.04 ± 7.92a |
| GVI E4 300 mg/kg b.w | 61.00 ± 13.16 | 195.2 ± 21.45 | 177.00 ± 11.66c | 170.00 ± 11.23ab | 141.06 ± 24.33a |
| GVII F1 400 mg/kg b.w | 107.60 ± 9.74 | 290.6 ± 30.61bc | 213.60 ± 16.42b | 158.40 ± 21.24ab | 114.09 ± 12.06a |
| GVIII F2 500 mg/kg b.w | 89.60 ± 3.69a,b | 244.4 ± 16.27b | 219.20 ± 16.82b | 214.40 ± 7.26b | 199.50 ± 10.22a |
Values are Mean ± SD of 5 determinations. Values with different alphabetical superscript along a column are significantly different at P<0.05, n=5. E3: Humic acid extract, E4: Humin extract, E2: Fulvic acid extract, F1: Crude methanol extract, F2: Chloroform extract, B.W: Body weight
Table 1: Serum glucose level of diabetic rats administered with white grub extracts and standard drug for 15 days.
Serum lipid profile
Table 2 shows significant increased (P<0.05) serum level of total cholesterol, LDL cholesterol, and atherogenic index while HDL cholesterol, triglycerides, and VLDL shows a significant decrease (P<0.05) compared to normal control. The standard drug-treated group shows significant decreased (P<0.05) in Total Cholesterol, Triglycerides, VLDL, LDL, and AI and significant increased (P<0.05) in HDL cholesterol. The extracts treated group shows significant decreased (P<0.05) in Total cholesterol, LDL, AI, and HDL cholesterol when compared with the diabetic control except for Chloroform extract that shows a normal value of HDL cholesterol when compared with the normal control group. Triglycerides and VLDL show a significant decreased (P<0.05) level when compared with the normal control group (Figure 2).
| Group Treatment | T.CHOL (mMol/L) | HDL.CHOL (mMol/L) | TAG (mMol/L) | VLDL (mMol/L) | LDL (mMol/L) | Artherogenic index (AI) mMol/L |
|---|---|---|---|---|---|---|
| GI Normal control | 3.36 ± 1.52a | 0.8 ± 0.25a | 1.17 ± 0.31a | 0.53 ± 0.14a | 2.3 ± 1.54a | 3.89 ± 1.39 |
| GII Diabetic control | 4.67 ± 0.21b | 0.58 ± 0.26b | 0.79 ± 0.26b | 0.36 ± 0.13b | 3.79 ± 0.29b | 8.55 ± 2.05 |
| GIII Glibenclamide 5mg/kg b.w | 1.60 ± 0.15c | 1.13 ± 0.33c | 0.75 ± 0.14b | 0.24 ± 0.07c | 0.85 ± 0.30c | 0.96 ± 0.47 |
| GIV E2 100 mg/kg b.w | 1.73 ± 0.48c | 0.53 ± 0.22b | 0.97 ± 1.56 | 0.44 ± 0.69 | 0.76 ± 0.57 | 4.71 ± 1.12 |
| GV E3 200 mg/kg b.w | 3.18 ± 0.96a | 0.54 ± 0.11b | 0.76 ± 0.88b | 0.35 ± 0.40b | 2.29 ± 0.90a | 4.29 ± 1.53 |
| GVI E4 300 mg/kg b.w | 2.46 ± 0.93 | 0.46 ± 0.22 | 0.92 ± 0.61 | 0.42 ± 0.26 | 1.58 ± 0.76 | 4.93 ± 0.92 |
| GVII F1 400 mg/kg b.w | 1.89 ± 0.38c | 0.39 ± 0.10 | 0.76 ± 1.50b | 0.35 ± 0.71b | 1.15 ± 0.35 | 3.98 ± 0.73 |
| GVIII F2 500 mg/kg b.w | 3.89 ± 2.16a | 0.80 ± 0.23a | 0.9 ± 0.40 | 0.41 ± 0.21 | 2.68 ± 2.29a | 2.75 ± 0.84 |
Values are Mean ± SD of 5 determinations. Values with different alphabetical superscript along a column are significantly different at P<0.05. n=5, E3: Humic acid extract, E4: Humin extract, E2: Fulvic acid extract, F1: Crude methanol extract, F2: Chloroform extract, B.W: Body weight
Table 2: Lipid profile and Atherogenic index parameters of diabetic rats orally administered with white grub extracts and standard drug for 15 days.
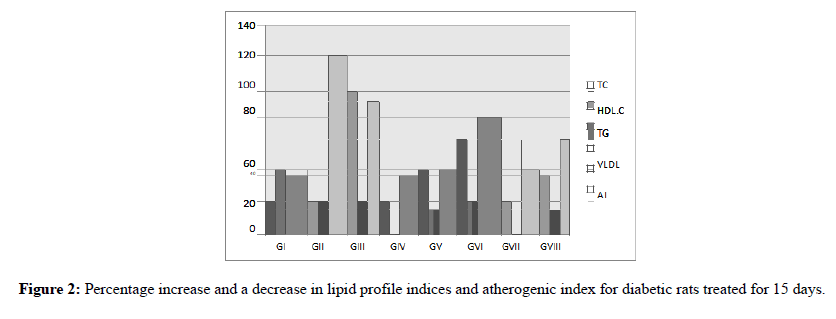
Figure 2: Percentage increase and a decrease in lipid profile indices and atherogenic index for diabetic rats treated for 15 days.
Normal range: Total cholesterol=3.1-6.2, HDL-choleseterol=0.9-1.9, Triglyceride=<1.77 VLDL=-LDL=<3.38.
Fourier transformed infrared spectroscopy (FTIR)
Figure 3 is the FTIR of the most active extract which shows Two types of CH bonds which were detected in the spectrum: sp2-hybridized CH bonds (3100-3000 cm–1), sp3-hybridized CH bonds (3000-2850 cm–1). The absorption bands (Figure 4) as the result of the nitro group: 2200 cm–1 and 2000 cm–1. They are at lower wave numbers than usual because the nitro group is conjugated with the benzene ring. The aromatic ring is responsible for the absorptions due to the sp2 CH stretching vibrations (3100-3200 cm–1); the ring skeletal vibrations at 1750 cm–1, 1500 cm–1, and 1350 cm–1; and the CH bending vibrations at 1050 cm–1, 950 cm–1, 800 cm–1, 750 cm–1 and 650 cm–1.
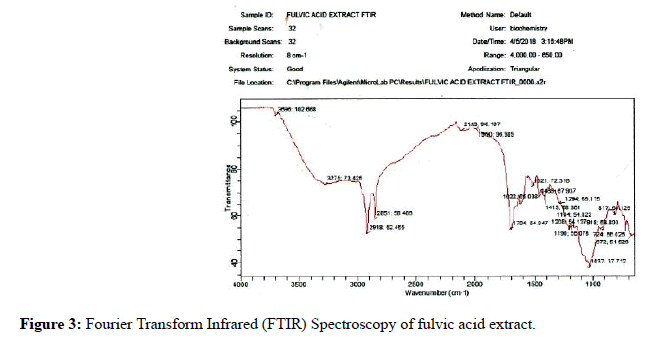
Figure 3: Fourier Transform Infrared (FTIR) Spectroscopy of fulvic acid extract.
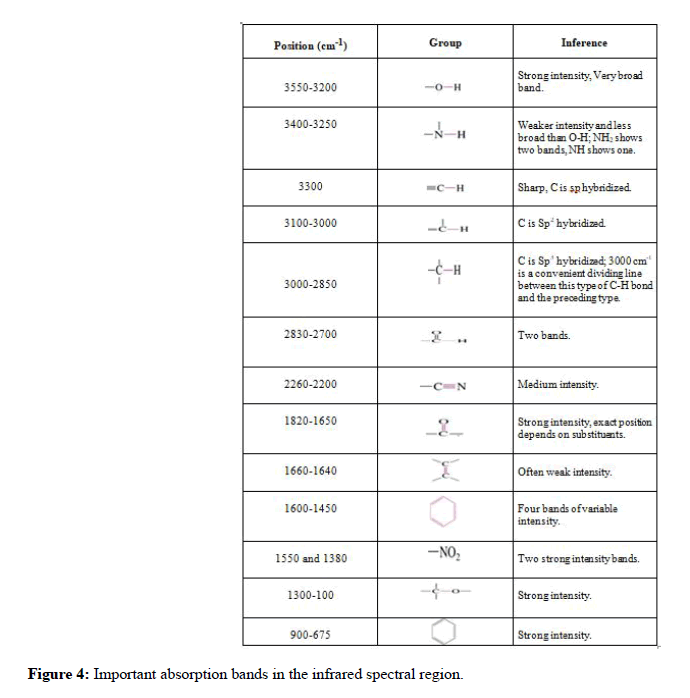
Figure 4: Important absorption bands in the infrared spectral region.
The gas chromatography-mass spectrum (GCMS)
Table 3 shows the GC-MS analysis of the most active extract (E2) with 22 compounds detected. Some of the compounds like urea, fatty acids, hydrocarbons and carbohydrate contained these functional groups carboxylic acid (- COOH), Hydroxyl (-OH), carbonyl (C=O), alkene (=), alkyne(≡≡), amino (NH2) and aldehyde (-CHO) which are detected in the spectrum.
| No | RT | Name of compound | MF | Area % | Quality |
|---|---|---|---|---|---|
| 1 | 49.6 | Formic Acid | CH2O2 | 5.47 | 27 |
| 2 | 55.127 | Methyl 11-(2-cyclopenten-1-yl) undecanoate | C17H30O2 | 0.73 | 17 |
| 3 | 55.348 | 7-hexadecanoic acid | C16H30O2 | 5.06 | 38 |
| 4 | 56.163 | Butanoic acid | C4H8O2 | 0.96 | 32 |
| 5 | 56.898 | Urea | N2H4CO | 0.27 | 2 |
| 6 | 57.359 | Acetonitrile | C2H3N | 0.87 | 4 |
| 7 | 58.133 | Thiirane | C2H4S | 0.32 | 4 |
| 8 | 58.66 | Carbonyl sulfide | COS | 0.45 | 2 |
| 9 | 59.17 | 1,5-Hexadiene | C6H10 | 0.3 | 10 |
| 10 | 60.345 | 3,4-dimethyl-chloroacetic acid | C6H11O2Cl | 0.33 | 9 |
| 11 | 60.942 | 3-methyl-1-Butene | C5H10 | 0.21 | 4 |
| 12 | 61.391 | 1-propene | C3H6 | 1.26 | 9 |
| 13 | 62.267 | 2-Butanamine | C4H11N | 0.22 | 4 |
| 14 | 63.36 | Hydrazine | N2H4 | 0.21 | 2 |
| 15 | 64.203 | Ethyl-2-Butanamine | C6H16N | 0.19 | 4 |
| 16 | 65.146 | Isoprene | C5H8 | 0.49 | 5 |
| 17 | 66.416 | 8-Nonyoic acid | C9H14O2 | 3.45 | 25 |
| 18 | 67.066 | Cyclobutanone | C4H6O | 0.47 | 14 |
| 19 | 67.421 | 2,3-Epoxyhexanol | C0H12O2 | 0.25 | 4 |
| 20 | 67.842 | 2-pentyn-1-ol | C5H8O | 0.38 | 9 |
| 21 | 68.278 | Didodecyl phthalate | C28H46O4 | 1.12 | 38 |
| 22 | 68.768 | D-Glucopyranose | C6H12O6 | 0.41 | 4 |
RT: Retention Time, MF: Molecular Formula
Table 3: GC-MS analysis of Fulvic acid extract.
The outcome of the present study showed that after 15 days of treatment with white grubs extract on diabetic and non-diabetic rats showed significant reduction effect (P<0.05) on their blood glucose level (Table 1). The fractions of white grub extract (GIV-GVII) show that all doses of extract significantly (P<0.05) lowered blood glucose levels on the 15th day with much reduction in GIV administered E2 100 mg/kg body weight which returns the blood glucose level to normal when compared with the normal control group. This extract E2 shows a similar effect with the standard drug. This indicates a positive effect of white grub extract on the 15th day of oral administration of white Grubs extract in reducing blood sugar. There is a marked increase in sugar level (hyperglycemia) in diabetic rats. The result agrees with already existing literature that alloxan induces diabetes mellitus by selectively destroying the beta cells of the pancreas which are involved in the synthesis of, storage and release of insulin, as well as the peptide hormone regulating carbohydrate, protein and lipid metabolisms [23] leading to marked increase in blood glucose concentration observed in rats after administration and confirms the development of diabetes mellitus [24]. The treatment goal for diabetes mellitus is to prevent or reduce the risk and severity of complications associated with it. This goal is best achieved by maintaining normal or near normal blood glucose and lipid profile levels. There is a marked increase in sugar level (hyperglycemia) in diabetic rats [25]. The extract may have achieved hypoglycemic property through increased insulin secretion, increased peripheral utilization of glucose, inhibition of endogenous glucose production or by inhibition of intestinal glucose absorption as reported in existing literature [23,26,27]. The extract may also have potentiated pancreatic secretion of insulin from existing residual beta cells of islets of Langerhans.
The diabetic control rats had elevated mean total cholesterol, low-density lipoprotein cholesterol (LDL-C) and atherogenic index, with decreased high-density lipoprotein cholesterol (HDL-C), triglycerides (TG), and very lowdensity lipoprotein cholesterol (VLDL-C) (Table 2). Fractions of white grub extract had shown a hypolipidemic effect in diabetic rats. E2, E3, E4, F1, and F2 significantly reduced (P<0.05) total cholesterol and LDL cholesterol compared to the diabetic control group with the highest deduction in GIV administered E2 (100 mg/kg). E2, E3, and F1 significantly reduced (P<0.05) HDL cholesterol compared to the diabetic control group and F2 show normal HDL cholesterol. E4, E2, and F2 treated group showed significantly increased (P<0.05) in triglyceride and VLDL levels compared to the diabetic control group. Significantly reduced (P<0.05) LDL cholesterol level with high reduction by fulvic acid extract compared to the diabetic control group. Significant decrease (P<0.05) in the serum TC, LDL-C, HLDL-C, for GIV, GV, GVI, GVII, and GVIII and TG, VLDL for GIV and GVI and significant increase in the TG, VLDL for GV, GVI and GVIII levels were observed in diabetic treated groups when compare with diabetic untreated group (GII). A significant increase in TC, TG, VLDL, and LDL-C and a significant decrease in HDL-C when compared to the GIII treated with Glibenclamide (5 mg/kg). The cholesterol, triglyceride, and LDL lowering effect coupled with HDL elevating effect of an extract may help in reducing complications associated with hyperlipidemia as a result of diabetes mellitus [28,29]. Figure 2 (Appendix) shows the percentage increase and a decrease in lipid profile indices and atherogenic index for diabetic groups treated with extracts and standard drug and diabetic group untreated.
From Figure 3 two types of CH bonds can be detected in the above spectrum: sp2-hybridized CH bonds (3100-3000 cm-1), sp3-hybridized CH bonds (3000-2850 cm-1).The absorption bands due to the nitro group: 1521 and 1294 cm-1. They are at lower wave numbers than usual because the nitro group is conjugated with the benzene ring. The aromatic ring is responsible for the absorptions due to the sp2 CH stretching vibrations (3100-3000 cm-1); the ring skeletal vibrations at 1621, 1465, and 1413 cm-1; and the CH bending vibrations at 918 cm-1, 817 cm-1, 724 cm-1, and 672 cm-1. On the basis of these absorptions, it is usually possible to determine the nature of the functional group that is present in the compound whose spectrum is being considered. Many functional groups require the presence of several characteristic absorptions, whereas the absence of a band in a particular region of the spectrum can often be used to eliminate the presence of a particular group. The result from the GC-MS analysis of E2 from the library of National Institute of standard (NIST14.L) showed 22 compounds possessing anti-diabetic potentials. It is possible that these compounds act synergistically to protect the pancreatic damage during oxidative stress, by either scavenging these free radicals such as superoxide anion radical (O2-), hydroperoxyl radical (HOO), hydrogen peroxide (H2O2), hydroxyl radical (OH), lipid peroxide radical (ROO) etc., or inhibiting the production of these radicals. Most of these compounds do this by their electrons, and their ability to donate their electrons lies in their structural orientations and their functional groups. Compounds like formic acid, 7-hexadecenoic acid, butanoic acid, 3,4-dimethyl chloroacetic acid, 8-nonanoic acid and methyl 11-(2-cyclopentene-1-yl) undecanoate have carboxylic groups (-COOH) as part of their functional groups and help in quenching the free radicals by donating its electron as a hydrogen atom. Compounds like Urea, carbonyl sulfide, and cyclobutanone have carbonyl group (-C=O) and compounds like 2, 3-Epoxyhexanol, 2-pentyn-1-ol have a hydroxyl group (-OH) as part of their functional groups.
White Grub is rich in fats, protein, some mineral elements [2] and humic substances (humin, fulvic and humic acids) [15]. Humic acids can apparently stimulate respiration and increase the efficiency of oxidative phosphorylation in rat liver mitochondria [30]. Cellular respiration, occurring only in the presence of oxygen, results in the breakdown of nutrient molecules to generate ATP. Cells such as the liver and muscle use this ATP for energy to fuel various processes like stimulating the uptake of nutrients, repair of dead or damaged tissue [31]. This may be due to their acidic functional groups, primarily carboxylic acid and phenolic hydroxyl groups, which give them the capacity to react with various species such as free radicals, minerals, and biological enzyme systems [32-34].
In conclusion, results obtained from the studies reveal the hypoglycemic and hypolipidemic properties of different fractions of white Grub extracts, with the fulvic acid extract (E2) being the most active. The E2 treated group had shown a similar effect compared with the reference drug (glibenclamide). White Grub extracts could be used in the treatment and management of diabetes mellitus and its related complications.