Research Article - Annals of Biological Research ( 2018) Volume 9, Issue 4
The development of computational morphometric identification systems in recent times has invariably made it possible for easy segregation of closely related species and subspecies using only wing features. In this research, assessment on possible variabilities within Apis mellifera adansonii in three ecological zones in Ghana were carried out based on 18 forewing landmarks’ variations on 1,500 honeybee samples collected from thirty colonies. Geometric morphometric analyses of the wings indicated that all the 18 Cartesian coordinates of landmark features displayed statistically significant differences within populations among the three ecological zones. The variability within the bee populations among the three ecological zones seemed to be attributed to the variations characterizing each ecozone. Among the 18 wing feactures, variations in 1st Basal vein junction 4, 1st Basal vein junction 5 and 1st recurrent vein junction 3 of wing morphometric features of honey bee workers contribute significantly to subspecies variabilities. These can possibly serve as an effective tool for subgroupings of Apis mellifera adansonii kept in beekeeping practice in ecological zone of Ghana.
Honey bees belong to the Kingdom Animalia, Phylum Arthropoda, the Class Insecta, and the Order Hymenoptera. This order includes over 100,000 miscellaneous species of bees. Ten species of Honey bee belonging to the genus Apis are commonly documented [1-3]. Phylogenetic analyses based on nuclear DNA and mitochondrial DNA (mtDNA) markers sturdily support categorizing these into three diverse groups: cavity-nesting bees (Apis mellifera, Apis cerana, Apis koschevnikovi, Apis nuluensis), giant bees (Apis dorsata, Apis laboriosa, Apis binghami, Apis nigrocincta), and dwarf bees (A. florea, A. andreniformis) [3,4]. Separately, all of these Apis mellifera species are presently cramped to Asia and the lineage that gave rise to extant Apis mellifera represents an early split from previous cavity-nesting bees, so it is mainly probable that Apis mellifera can eventually outline its source to Asia. Evolutionary interaction between the thousands of bee species that have been classified will unquestionably keep up to change as more information is analyzed, as is happening in the taxonomy of other animals for which the genome has previously been mapped. As a result of the actions of beekeepers it is now broaden across the entire world, but its native range is large and dissimilar, on both sides of Europe, Africa, and the Middle East. Subsequent to four years of work by hundreds of scientists, the sequencing of the 236-million-base genome of the European Honey bee Apis mellifera was completed in 2006. This is the fifth insect that has been sequenced to date, and before now over 10,000 genes that influence social behaviour and physiology have been recognized. The diversity of subspecies is perhaps the result of Early Pleistocene radiation aided by climate and habitat changes during the last ice age. The modern analyses do not clearly place the root of the tree of Apis mellifera subspecies within Africa, and are potentially reliable with a variety of hypotheses for Honey bee evolution, together with an extension out of Asia [5].
Though Linnaeus deduced the original description of Apis mellifera subspecies, little information is available. This race has been comparatively well studied in the western part of its range, especially in France and Britain, and also in southern Scandinavia. Almost nothing is known about the extent of its range and its variability towards West Africa particularly in Ghana. Ecotypic variation has been described and confirmed for species in France [6,7], where also several conservation areas have been established. Bees are organisms and as such, are naturally variable at the molecular, individual, and population levels. This variability means that a researcher needs to separate the various sources of variability restricted in the dimensions. The past may be due to treatments received, bee age, or innate differences in resistance. The final is largely due to the genetic background and its phenotypic expression that characterizes individual living organisms. As a result of this great variability, the sub-specific taxonomy of Apis mellifera such as evolutionary history, phenotypic plasticity and population structure have been very extensively studied. This species covers a large distribution area, extending throughout almost all of Africa and Europe and part of Asia. Along this distribution, Apis mellifera occupies quite varied ecological niches, from desert zones to tropical rain forests and from mountainous regions to swamps [8,9]. Despite the economic importance of Apis mellifera adansonii to Ghana and West Africa as a whole, there are substantial gaps in our knowledge about its possible subspecies variability at ecozone level and possibly generating ecotype within the subspecies.
The aim of this study was to assess possible subgrouping variations within Apis mellifera adansonii subspecies among three Agro-ecological zones of Ghana.
Geometric morphometrics’ ability to segregate possible subgroups existing within the subspecies will contribute to improve the scientific knowledge of Apis mellifera adansonii in Ghana in order to assess their diversity. This knowledge will improve our understanding of the level of potential subspecies associations among subgroups, its subsequent impact on beekeeping management practices aiming to formulate policies for conservation.
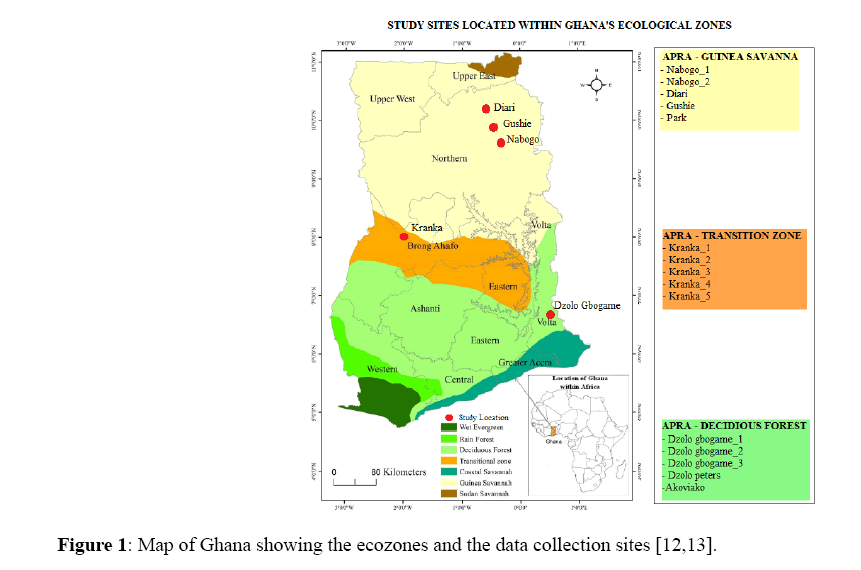
The study was conducted at honey bee apiaries located in three ecological zones in Ghana; Guinea Savannah Zone, Transition Zone and Semi-Deciduous Forest. Twenty one bee keepers within the various ecological zones were contacted, however, only those located at the chosen ecological zones were willing to give out their colonies for the research work (Figure 1).
Study areas that were selected for this study were primarily within Ghana’s apiculture industrial hub [10]. The ecozone characteristics follow the descriptions in FAO [2,11,12].
Selection of experimental areas
Preliminary survey was conducted within the first week in January, 2015 to locate the presence of honey bee centres at the various selected areas. A day was spent at each area for reconnaissance in order to locate the various apiaries and field assistants. Local beekeeping farmers and the indigenous honey-hunters residing near the study sites were involved in the reconnaissance. The areas were selected based on the presence of honey bee apiaries, willingness of bee keeper to participate in this research and within ecozone characteristics.
Data collection and sampling techniques
For this study, fifty worker honey bee samples were randomly collected from the entrance of each of the 30 colonies, totally 1,500 worker bees. Entomological net was placed at the entrance of bee hive and escaping honey bee workers leaving the hive were collected and killed in soapy water before being temporarily stored in 70% ethanol. Bees were sampled at the nest entrance in order to ensure that each specimen of bees used in this work accurately belong to the same gene colony and possibly share the same gene pool with other bees collected from the same colony [2,14].
The first day of the experiment of each ecological zone was used to collect honey bee samples from each apiary. Two hives were selected from each of the apiaries. The sample collection was done within the period of 6:00pm-11:00 pm when the temperature was low and bees were less aggressive. Sample of some specimens in 70% alcohol were deposited at the University of Cape Coast Entomology Museum for geometric morphometric assessment.
Laboratory work
Sampled collection of honey bees (Apis mellifera adansonii) was taken to the University of Cape Coast Entomology museum for confirmation of identification. The specimens were identified to subspecies level with the help of a taxonomist. The bees were cleaned thoroughly. The right forewings wings which would enable identification were detached from the species with the use of forceps and the rest of the species preserved in alcohol. Wings mounted on a slide were viewed under the microscope to locate landmarks of these wings which would automatically calculate the coordinates within the various landmarks.
Geometric morphometric
The right forewings were removed from each individual bee with a forceps into a petri dish. The wings were mounted on microscope slides after rinsing in ethanol with decreasing concentrations (70% to 20%). Care was taken to mount the wings flat on the slide, without any folds or distortions and also to face the same direction to facilitate measurements [2].
Mounted wings were covered with microscope slide covers and fixed together with adhesive. Mounted wings were then labeled with sample identification.
Images of each of the mounted wing were captured and digitized through a camera coupled to the stereomicroscope using the Leica Application suite version 3.4.1. All the captured images were imported into TPS file utility program to scramble or restore the original order of wings in order to build TPS file to minimise bias in digitizing landmark locations.
Anatomical points were marked from the TPS file using the TPSDig, version 1.40 [15]. to facilitate the statistical analysis of landmark data from digitized images (Figure 2a, b).
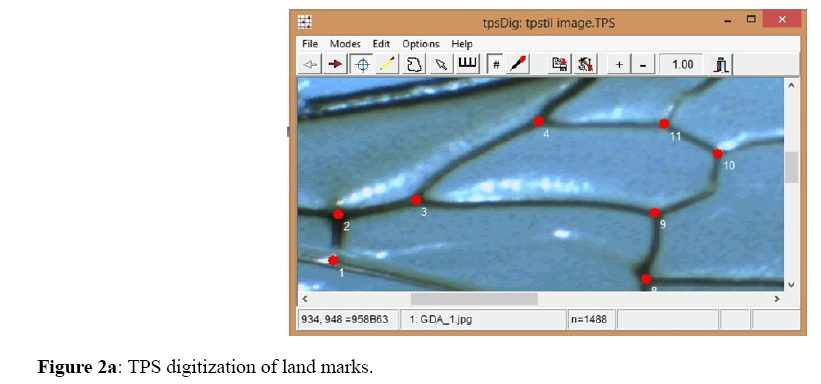
Figure 2a: TPS digitization of land marks.
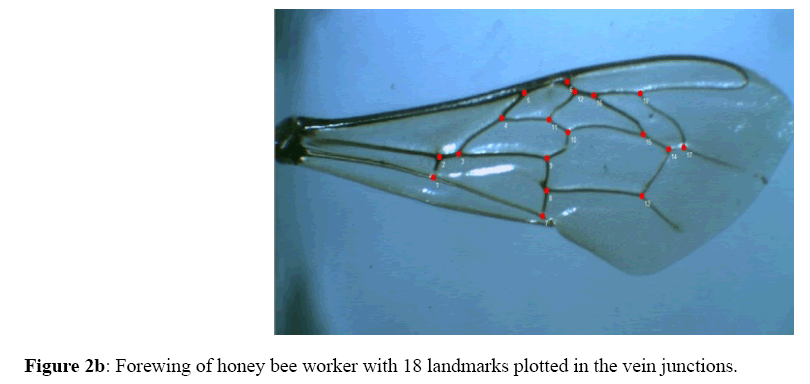
Figure 2b: Forewing of honey bee worker with 18 landmarks plotted in the vein junctions.
The data obtained in TPSDig, which represent the position of coordinates of each anatomical point in a Cartesian plan, were exported to the MorphoJ program for the morphometric analyses. These data allowed performing the processes of overlapping (translation), proportion and rotation.
To assess the variation between the three study populations, multivariate statistical analyses (Procrustes Fit, Principal Component Analysis, and Discriminate function analysis) were carried out on a geometric morphometrics data collected from the same set of samples taken from the three different ecological zones of Ghana.
Generalized procrustes analysis (GPA) was used for the translation and rotation of each sample.
Procrustes fit
The samples were individually scaled and their landmark coordinations were transferred to the general coordinate system (superimposition). The procrustes fit aligns shapes and minimizes differences between them to ensure that only real shape differences are measured among the population and between the three ecozones [16].
In this research, the data for each wing (i.e., the raw x and y coordinates of the landmarks) were loaded into MorphoJ 1.02j, and shape coordinates were computed by performing a General Procrustes Analyses (simply called ‘Procrustes fit’ in MorphoJ).
Principal component analysis
A geometric morphometric method has the ability to describe the diversity between different shapes. Two methods are usually used to do this: principal component analysis (PCA) and canonical variates analysis (CVA) [17].
PCA was used in this research in order to distinguish the populations among the three ecological zones in terms of adaptation and morphometrics. PCA also simplifies the data and makes it easier to interpret findings by creating new coordinate systems that are linear representations of the original data, uncorrelated to each other. Clusters of populations within the three different ecozones were explained in PC plots. However, PC scores shape coordinates were used to investigate shape variation when tested by multivariate statistics.
Eigen vectors were normalized, while the distribution of the groups inside the space were evaluated, accordingly [18]. The Eigen values from the Principal Component were used to calculate the range of variance on each PC axis.
Discrimination function analysis
Discriminate function analysis is useful in determining whether a set of variables is effective in predicting category membership. In this research, discrimination function analysis (DFA) score was used to distinguish each population from the other and also to reveal the distribution of the groups in relation with the correlation between the characters. Differing from Principal Component Analysis, the species were categorized based on ecological zones before the analysis. Cross validation information was used to evaluate the predictive accuracy of the data set.
A one-way ANOVA was used to determine the variation between subspecies from the different ecological zones. Results such as among-group variance (SS Model), within-group variance (SS Residual), total variance (SS Total) and statistical significance of the difference between the population and among the three different ecological zones were calculated.
In ascertaining morphometric variability among studied honey bee populations that has shown strong correlation between climatic conditions and honey bee population as morphometric unit, bees were subjected to geometric morphometric analyses.
Multivariate analysis of variance (AMOVA) of Cartesian coordinates of the landmarks on the forewing showed that all the 18 Cartesian coordinates of landmarks displayed statistically significant differences within colonies of honey bee groups and among the three ecological zones (P < 0.0001, Procrustes SS=1.0845, Tanget SS=1.0836) (Figure 3) (Table 1).
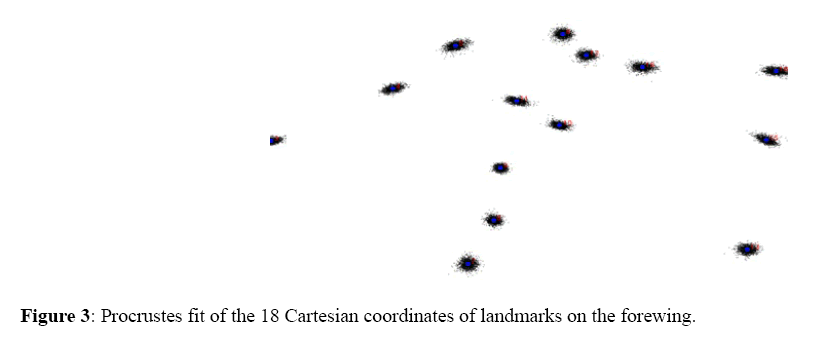
Figure 3: Procrustes fit of the 18 Cartesian coordinates of landmarks on the forewing.
| Land mark. | Axis 1 (x) | Axis 2 (y) |
|---|---|---|
| 1 | -0.38612476 | -0.06557498 |
| 2 | -0.37302291 | -0.01339428 |
| 3 | -0.3051874 | -0.00658049 |
| 4 | -0.17077649 | 0.06479005 |
| 5 | -0.10142079 | 0.12331105 |
| 6 | 0.0168358 | 0.1389474 |
| 7 | -0.08772177 | -0.17426139 |
| 8 | -0.05928253 | -0.11468392 |
| 9 | -0.05207409 | -0.04340975 |
| 10 | 0.01305146 | 0.01483936 |
| 11 | -0.03407095 | 0.04801656 |
| 12 | 0.04274717 | 0.11018052 |
| 13 | 0.22035162 | -0.15449736 |
| 14 | 0.31726527 | -0.05285027 |
| 15 | 0.24136405 | -0.00523603 |
| 16 | 0.10476975 | 0.09399111 |
| 17 | 0.36094841 | -0.05218678 |
| 18 | 0.25234816 | 0.0885992 |
| Procrustes sums of squares: 1.0845861719551 | ||
| Tangent sums of squares: 1.083633652611386 | ||
The Mahalanobis square distance between the centroids were also significant among the population and between the three ecological zones (Discriminate Function Analysis, P<0.0001) (Figure 4).
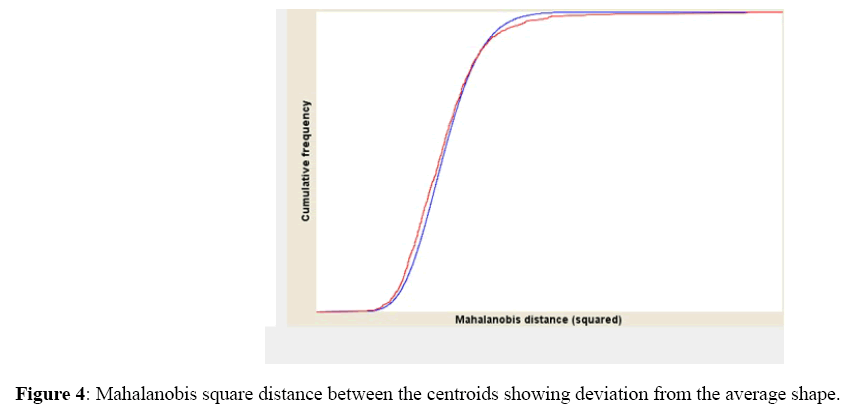
Figure 4: Mahalanobis square distance between the centroids showing deviation from the average shape.
Principal component analysis
The first 14 Eigen values were found to be greater than one and contributed 84.7% of data variability. The first 3 factors (PC1, PC2, and PC3) showed greater variation which explained 79.74% of the total variability (Figure 5). Each factor (PC1, PC2, and PC3) contributed 15.54%, 26.69% and 37.51 respectively.
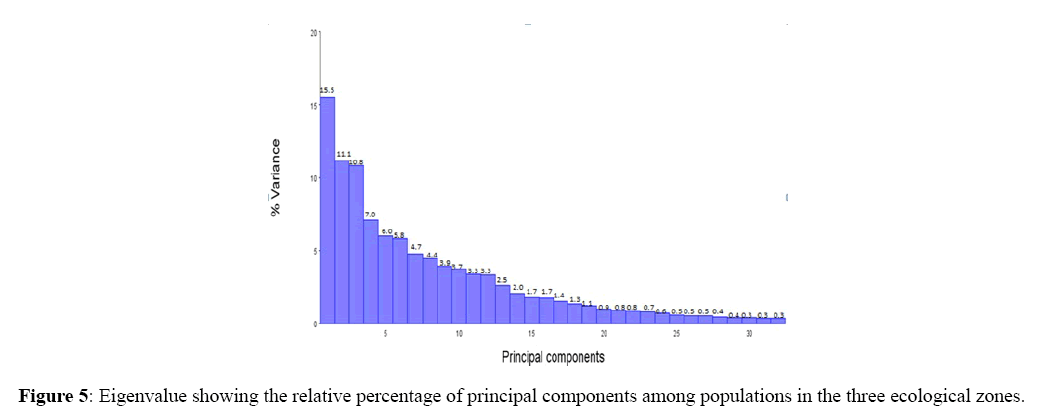
Figure 5: Eigenvalue showing the relative percentage of principal components among populations in the three ecological zones.
The scatter plot of the Principal Component Analysis of honey bees based on wing morphometric characters demonstrated that all the populations among Guinea Savannah Zone, Semi-Deciduous Forest and Transition Zone were clustered very closely within the centroid.
However, few populations seem to pull out from the centroid (Figure 6). Population within Guinea Savannah Zone and Transition Zone clustered very closely hence made up a large cluster as compared to population within Semi- Deciduous Forest. The 1st Basal vein junction 1,1st Basal vein junction 5 and 1st recurrent vein junction1 of the honey bee forewing showed the major shape variation of the total variability among the populations within the three ecological zones.
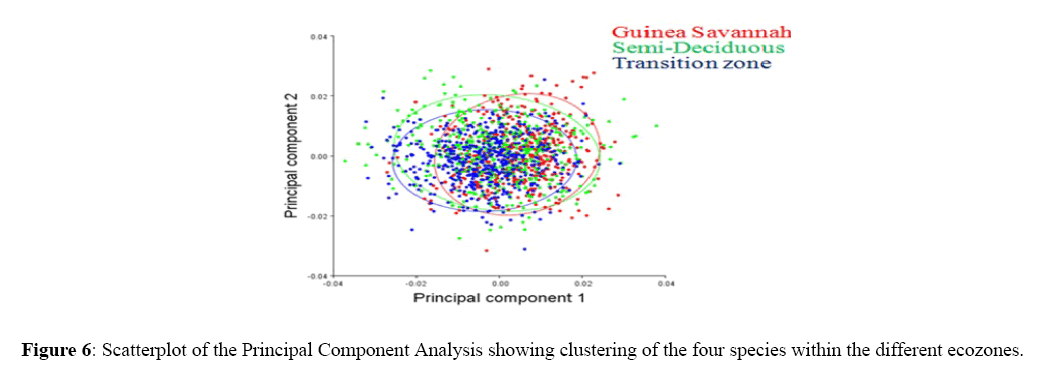
Figure 6: Scatterplot of the Principal Component Analysis showing clustering of the four species within the different ecozones.
Discriminant function analyses
The 1st Basal vein junction and the 1st recurrent vein junction of the honey bee forewing showed the major shape variation of the total variability among the populations within Guinea Savannah Zone and Semi-Deciduous Forest. On the other hand, the 1st Basal vein junction 1,1st Basal vein junction 4,1st Basal vein junction 5 and 1st recurrent vein junction 3 Cartesian coordinates showed the major shape variation of the total variability among the populations within Guinea Savannah Zone and Transition Zones. However, 1st Basal vein junction 1 and 1st Basal vein junction 5 also showed shape variation among the populations within Semi-Deciduous Forest and Transition Zone (Figure 7 a-c).
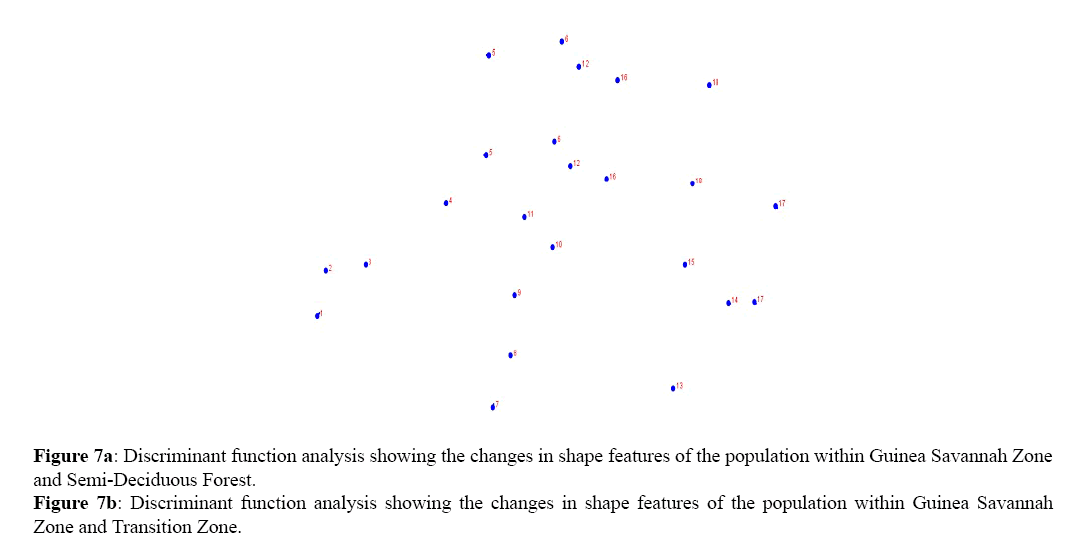
Figure 7a: Discriminant function analysis showing the changes in shape features of the population within Guinea Savannah Zone
and Semi-Deciduous Forest.
Figure 7b: Discriminant function analysis showing the changes in shape features of the population within Guinea Savannah
Zone and Transition Zone.
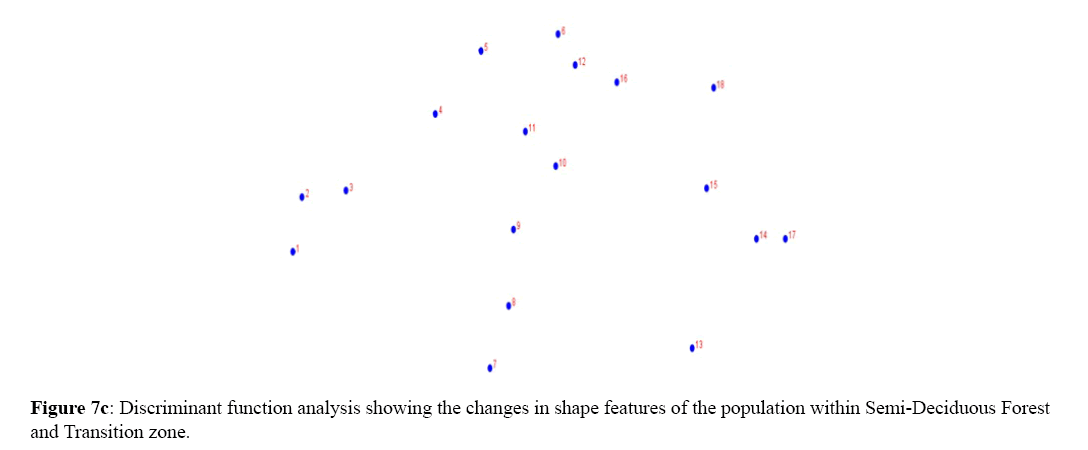
Figure 7c: Discriminant function analysis showing the changes in shape features of the population within Semi-Deciduous Forest and Transition zone.
Among the honey bee population within Guinea Savannah Zone and Semi-Deciduous Forest, Discriminate Function Analyses scores were able to distinguish Guinea Savannah Zone from Semi-Deciduous Forest with 80% accuracy in cross validation (Figure 8 a & b). On the other hand, honey bee population within Guinea Savannah Zone were discrete from the honey bee populations within the Transition Zone with 91% accuracy in cross validation (Figure 9 a & b). The honey bee populations within the Transition Zone were also discrete from the honey bee population within Semi-Deciduous Forest with 80% accuracy in cross validation (Figure 10 a & b).
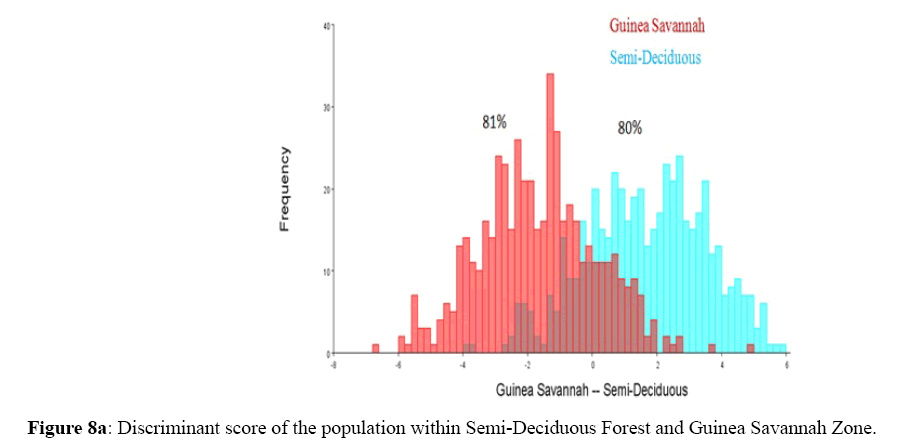
Figure 8a: Discriminant score of the population within Semi-Deciduous Forest and Guinea Savannah Zone.
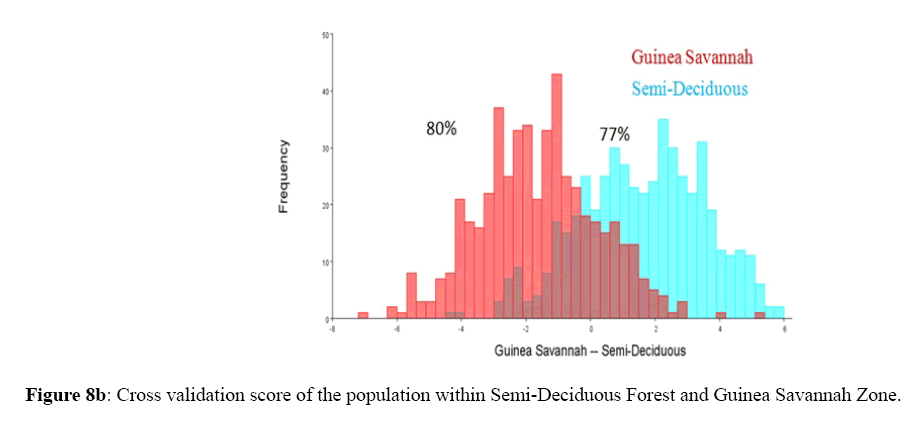
Figure 8b: Cross validation score of the population within Semi-Deciduous Forest and Guinea Savannah Zone.
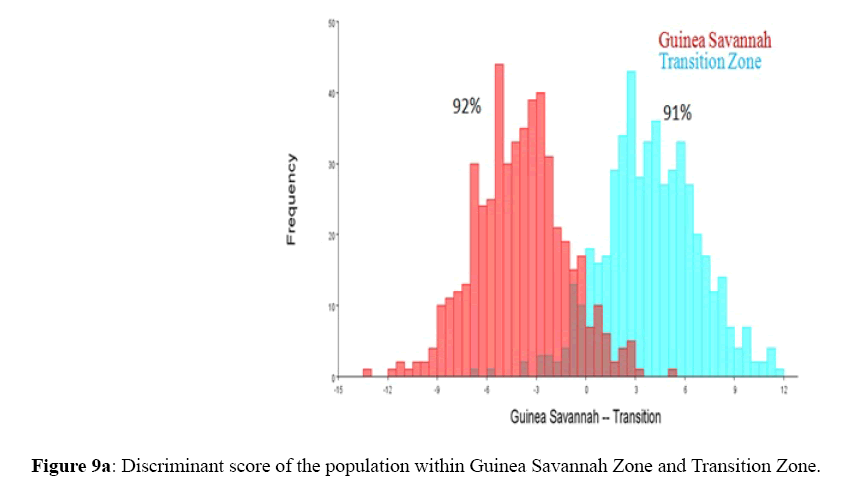
Figure 9a: Discriminant score of the population within Guinea Savannah Zone and Transition Zone.
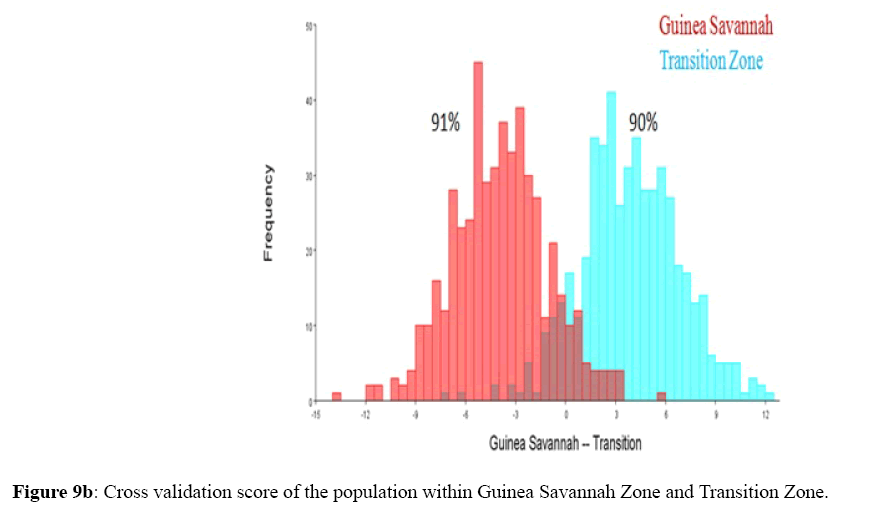
Figure 9b: Cross validation score of the population within Guinea Savannah Zone and Transition Zone.
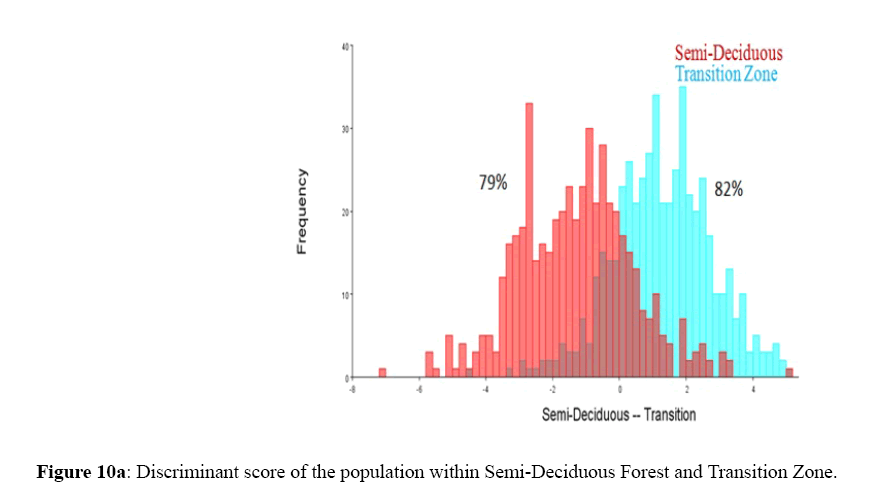
Figure 10a: Discriminant score of the population within Semi-Deciduous Forest and Transition Zone.
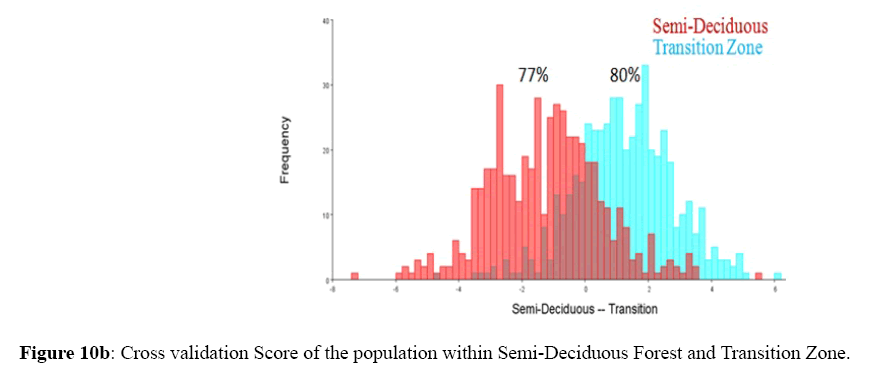
Figure 10b: Cross validation Score of the population within Semi-Deciduous Forest and Transition Zone.
There was significant (p<0.0001) different among population and between ecological zones.
By means of the evolution of computational morphometric identification systems, it is now achievable to identify species of various groups of insects using only wing features [1,2,19,20].
There are numerous factors that affect honey bee taxonomy, especially ecological zone [21].
In this present study, geometric morphometric technique was able to capture distinct groups within the ecological zone. Eighteen (18) taxonomic characters of honey bees’ wing clearly indicated marked variations within and between populations among the ecozones. Three of the bees’ wing features were found to significantly contribute to sub species variability as indicated as the first three eigenvalues. This implies that, honey bee wings are strong taxonomic structures that can discriminate distinct groups and that the variability of environmental conditions is possibly translated into morphometric properties of the honey bee populations. Our current findings is supported by similar studies in Brazil [1] that geometric morphometric differences of a single wing cell can successfully discriminate Apis mellifera into racial or possible ecozone types.
Among the three ecological zones, variability within the sub species Apis mellifera adansonii appears to be wider between populations within Semi-Deciduous Forest along the centroid. A number of factors can account for this phenomenon key of which is latitudinal distribution of organisms in the environment. Gaston reported that, several environmental variables correlated with latitude of organism habitat influences biological diversity with time [22]. Combey et al. work on four African stingless bees indicated that, species within ecozones seem to polarize towards specific geographic location (latitudes and longitudes) with similar environmental parameters such as rainfall/ precipitation, potential evapotranspiration and vegetation cover [2].
In the same regard, ecozones that shared closer distances appear to harbour more similar populations as compared to ecozones with populations further apart. For instance, in the discriminate function assessment between populations among two ecological zones, populations within Semi-Deciduous Forest and Guinea Savannah Zone were more distinct as compared to population between Guinea Savannah Zone and Transition Zone or Semi-Deciduous Forest and Transition Zone. Diniz-Filho et al. also observed that population similarity decreases with the increase of the geographic distance [14].
In the cross validation score, group of honey bee population within Semi-Deciduous Forest were observed to be distinct from population within Guinea Savannah Zone even though they might be similar morphologically. In addition, some group within the two ecological zones also seems to be similar and clustered together. Confirmation to this was seen in the PCA result which showed that, most honey bee populations within Semi-Deciduous Forest and Guinea Savannah Zone seem to pull away from the centroid whereas few populations seem to overlap within the centroid. For example, Dzolo Gbogame and Akoviako colonies within Semi-Deciduous Forest were observed to be distinct from Diari, Gushie and Nabogo colonies within Guinea Savannah Zone. Meanwhile, colonies from Dzolo Peters and Park within Semi-Deciduous Forest and Guinea Savannah Zone respectively were observed to be similar and clustered together.
In addition, the two honey bee populations studied within Guinea Savannah Zone and Transition Zone were also observed to show more similarities. Only few among the populations within these two ecological zones were distinguished from the other. This is in conformity with the Principal Component Analyses and Cross Validation Score which showed that, population within Guinea Savannah Zone and Transition Zone clustered very closely hence made up a larger cluster as compared to population within Semi-Deciduous Forest and only few seems to pull out from each other. Specifically, colonies within Gushie, Park and Diari Apiaries in Guinea Savannah Zone as well as colonies within Krankam “1”, Krankam “2” and Krankam “5” apiaries in the Transition Zone were all observed to overlap whereas, only colonies found within Nabogo and Krankam “5” apiaries in the Guinea Savannah Zone and Transition Zone seem to pull away from each other.
Based on the Principal Component Analysis scores and Cross Validation results, there seems to be significant variability between the honey bee populations studied among Semi-Deciduous Forest and Transition Zone. On the other hand, few groups of colony between the two ecological zones were also observed to be much similar to each other. For example, group of colonies within Dwolo Gbogame and Akoviako apiaries in the Semi-Deciduous Forest were all observed to be distinct from colonies within Krankam “1”, Krankam “3”and Krankam “4” apiaries in the Transition Zone. Furthermore, colonies within Dwolo Peters and Krankam “5” in Semi-Deciduous Forest and Transition Zone respectively seem to overlap.
This shows generally that, although the honey bee populations within the three different ecological zones are known to belong to the same subspecies [23] work, yet variability within the population among the three ecozones seems possible. The differences between the populations among the ecozones may be influenced by agricultural practices such as migratory apiculture, contributing to the genetic derivation with the introduction of new bees, altering the analyses on a wide geographical scale [24]. Besides the migratory condition of colonies, apiarists commonly trade the queen bee, which may have contributed to some population similarities found in Apis mellifera adansonii bees among the ecozones.
Similar observation in this study was found in Güler and Kaftanoğlu 2010’s work, where different geographic regions showed distinct types of vegetation and climate and it was observed that, the subspecies Apis mellifera carnica and Apis mellifera caucasica using geometric morphometrics of the front wing to evaluate different ecological regions, showed efficient population differences.
The three wings veins of taxonomic importance that can be used to morphologically segregate possible subgroupings within subspecies Apis mellifera adansonii are 1st Basal vein junction 4,1st Basal vein junction 5 and 1st recurrent vein junction 3
Honey bees, Apis mellifera adansonii among the three different ecological zones seem variable and ecozone specific.
The geometric morphometric analyses clearly indicated distinct possible ecotype variations within the sub species Apis mellifera adansonii among the three different ecozones in Ghana.
Among the three ecological zones, variability within the sub species Apis mellifera adansonii appears to be wider between populations within Semi-Deciduous Forest along the centroid. However, ecozone that shared closer distances appear to harbour more similar populations as compared to ecozones with populations further apart.
Three of the eighteen bee wing characters were found to significantly contribute to the sub species variability.
Further, variations in 1st Basal vein junction 4, 1st Basal vein junction 5 and 1st recurrent vein junction 3 of wing morphometric features of honey bee workers seem to comtribute significantly to the variations within the subspecies.
Molecular studies should be conducted on populations from all known ecological zones to compare the trend of metric variability among the subspecies Apis mellifera adansonii in Ghana.
Further, the outcome of this research can serve as an effective tool for segregating possible subgroupings of Apis mellifera adansonii kept in beekeeping practice in ecological zone of Ghana.