Research Article - European Journal of Sports & Exercise Science ( 2018) Volume 6, Issue 3
The aim of this study was to determine the forces applied at the foot-rest during ergometer kayaking and their correlation to power, VO2peak and competition time. Ten competitive kayakers (7 men, 3 women) participated voluntarily in the study. Exercise capacity was measured as maximal oxygen consumption (VO2peak) and peak power during two and four minutes all-out exercise test on a kayak ergometer. External force sensors were attached to the wires connecting the paddle to the fan of the kayak ergometer. Foot-rests were built to enable measurements of pushing and pulling forces and to distinguish between the left and right foot. Paddle forces correlated significantly to power, VO2peak and on-water competition time at 500 meter but not at 1000 meter. Pulling forces on the foot-rests correlated significantly to power, VO2peak and competition time at 500 and 1000 meters, whereas no significant correlations were found for pushing forces on the foot-rest. No significant correlation was found between forces in the paddle and the foot-rest. To the best of our knowledge, we have for the first time demonstrated that pulling forces at the foot-rest influence kayaking performance.
Biomechanics, Maximal exercise test, Motion analysis.
For analysis of elite sport performance, ergometers are constructed to reflect the specific sport performance analysed [1]. The ergometers assess the work or power during the test [2] and sometimes also assess specific performance indices such as distance, time and speed. Few ergometers provide information about force development during exercise. In kayaking, air braked kayak ergometers are often used for measurement of power output [1]. Previous testing on kayak ergometers [3] has shown these tests to reflect the physiological response during flat-water kayaking.
Kayaking engages large muscle groups to drive the kayak as fast as possible through the water. The kayaker has to overcome the drag force, which acts in the opposite direction to movement. Hydrodynamic (boat) and aerodynamic (boat and paddlers) drag forces are generated as the kayak moves through the water [4]. The paddle in the water acts to transmit the net forces developed within the kayak by the paddlers to provide forward propulsion. The forces developed at the paddle driving the kayak through the water have been thought to be produced mainly by upper body muscles [5-7].
There have only been few studies of the forces developed within the kayak during paddling. Aitken and Neal [8] found peak forces of 200 N in sub-elite kayak paddlers to be applied to the paddle during kayaking. In elite kayak paddlers Baker [9] measured peak forces of about 375 N at the paddle. Since force development at the foot stretcher during the driving phase of the stroke has been shown to influence power output in rowing [10], similar conditions may apply to kayaking. We are not aware of any previous studies of the forces at the foot-rest and seat in kayaking, as also pointed out in a recent review article [4].
The aim of this study was to determine the forces applied at the foot-rest during kayaking and their correlation to power, VO2 peak and on-water competition time.
Subject
Ten kayakers (7 male, 3 female, age 22.5 ± 3.3 year, weight 78.5 ± 11.4 kg, height 184 ± 10 cm) competing at different levels participated voluntarily in the study. The study was approved by the regional ethical review board at Lund, Sweden and the study has been performed according to the ethical standards in sports [11].
Study design
The subjects performed tests to examine exercise capacity, power and VO2 peak, and measurements of forces in the paddle and foot-rests during kayaking simultaneously. The subjects were familiar with the testing procedure. The subjects were told not to eat or drink coffee two hours before the test session. They were also told not to perform any heavy exercise 48 hours before the tests.
Exercise capacity
Five kayakers performed a two minutes all-out VO2 peak test and five kayakers performed a four minutes all-out VO2 peak test on a kayak-ergometer (Dansprint PRO, Dansprint Asp, Hvidovre, Denmark) after 12 minutes warm up on three different sub-maximal levels on the kayak-ergometer. VO2 peak was measured breath-by-breath (Oxycon Mobile, Jeager, Hoechberg, Germany) in four subjects and with mixing chamber (Oxycon PRO, Jeager, Hoechberg, Germany) in six subjects. Both systems were validated against measurements with Douglas bags and repeated measurements have been performed showing a coefficient of variance for VO2 of 3% [12-15]. The subjects were verbally encouraged to exercise as hard as possible. Calibration of the gas sensors was performed before each test with a certified gas mixture. Air flow was calibrated before each test using a calibration syringe. The calibration of the Dansprint PRO was verified before each test.
Force and power analysis
The kayak ergometer (Dansprint PRO, Dansprint Asp, Hvidovre, Denmark) used during the exercise capacity testing, was equipped with one-dimensional external force sensors attached to the wires connecting both the left and the right side of the paddle driving the flywheel of the kayak ergometer. Individual foot-rests for the left and right foot were built to enable measurements of pushing and pulling forces. Individual adjustments of the foot-rests were possible in accordance with the original foot-rest design. Foot straps were used to maintain the position of the foot during kayaking.
The force sensors were manufactured for this specific application. The sensors attached to the wires are based on small and light steel rings fitted with strain gauges. The force sensors work as a proving ring, sometimes called Morehouse proving ring, with the exception that the mechanical dial gauge is replaced with strain gauges. The footrest sensors were integrated in the foot-rests.
The force is obtained by measuring the strain due to bending of the support of the foot-rests. The measured strain is translated to force during the calibration where the foot-rests are loaded with known forces in the same location and direction as the forces from the feet. The strain gauges in both types of sensors are coupled in full a Wheatstone bridge, which makes the force sensors insensitive to factors such as temperature and resistance in the sensor wires. The sensors were calibrated by applying known linear forces in the same range as the measured forces.
Since the sensors are made of steel, which possesses linear elastic material properties, and the load of the sensors is far below the yield strength of the material, the sensors have a linear and hysteresis-free relation between the force and the output signal (strain). Data signals from the force sensors were collected through electric cables with LabWeiw 8.0 via the data acquisition system DAQPad-6015 and SC-2345 from National Instruments (Austin, Texas, USA) and data signals from the kayak ergometer were collected with the Dansprint Analyser 1.09 (Dansprint Asp, Hvidovre, Denmark).
Data analysis
Exercise capacity: The absolute VO2 peak was defined as the highest recorded value during the last minute of the test. Oxygen consumption reached a plateau and the respiratory exchange ratio (VCO2/VO2) exceeded 1.10 in all subjects. Power was the mean value throughout the all-out tests recorded on the kayak-ergometer.
Forces at the paddle and foot-rest: Forces at the paddle and foot-rest were recorded over two and four minutes, respectively, depending on the duration of the maximal all-out test. Prior to all tests, a reset was performed on the unloaded force sensors in order to adjust the zero-levels. The peak to peak amplitude of the electrical noise was 0.4 N for the sensors at the paddle and 0.8 N in the footrests. A frequency distribution of force over time was generated and the 95th percentile of force was taken as peak force.
This procedure was used in order to reduce the impact of the variance of peak force during each paddle stroke during the measurement. The peak forces were taken at the 95th percentile of the forces during the maximal all-out test. The percentile values provide representative key values of peak forces where variations of the individual peak values are filtered out. The variations of the peak values arise mainly due to variations of the paddle strokes but to some extent also due to oscillation of the springs that drives the flywheel of the kayak. The oscillations in form of electrical noise are negligible compared to the magnitudes of the forces. The analysis was performed using LabView 8.0 and Matlab R2006a.
Competition time: Competition time was peak time on-water paddling during the competition season.
Statistics
Values throughout are given as means and standard deviations ( ± SD). Student t-test was used when comparing means. Pearson’s correlation coefficient (rp) was used to analyse interrelationships between variables. Stepwise multiple linear regression analyses, both backward and forward, were performed to discover explanatory indices of mean power during paddling on a kayak-ergometer.
In the backward regression, independent variables were excluded due to co-linearity during the multiple regression analysis. When no co-linearity was found between independent variables, a forward regression analysis was performed. Power was the dependent variable while VO2 peak, paddle forces, pulling forces and pushing forces were the independent ones. The mean values of left and right forces were used in the multiple linear regression analyses. Multiple regression models are reported together with the adjusted R2 values as assessments of the goodness-of-fit. SPSS (Version 13.0, SPSS Inc. Chicago, Illinos, USA) was used for the statistical analyses. The p<0.05 criterion was used for establishing statistical significance.
The results of measurements are presented in Table 1 and recordings of paddle and foot force curves in Figure 1. The subjects are sorted by increasing power during the test. As expected from the selection procedure, there were substantial differences in power (77 %) and VO2 peak (59 %) during all-out exercise.
| All-out (min) |
Power (W) |
VO2peak (L/min) |
Paddle (N) |
Foot left (N) |
Foot right (N) |
Competition time (min sec) |
|||||
|---|---|---|---|---|---|---|---|---|---|---|---|
| Left | Right | Push | Pull | Push | Pull | 500 m | 1000 m | ||||
| F | 2 | 155 | 3.25 | 145 | 142 | 175 | 7 | 106 | 39 | 2.13 | 4.37 |
| F | 4 | 182 | 3.42 | 179 | 187 | 716 | 75 | 585 | 78 | 2.00 | 4.19 |
| M | 2 | 187 | 3.71 | 203 | 209 | 330 | -18 | 241 | 18 | 2.11 | 4.34 |
| M | 2 | 188 | 3.80 | 187 | 197 | 363 | 92 | 429 | 65 | 2.02 | 4.19 |
| F | 2 | 235 | 4.07 | 187 | 197 | 584 | 186 | 667 | 115 | 1.54 | 3.57 |
| M | 2 | 241 | 4.89 | 240 | 240 | 500 | 110 | 392 | 57 | 1.51 | 4.03 |
| M | 4 | 245 | 4.84 | 228 | 205 | 385 | 152 | 293 | 84 | 1.55 | 4.03 |
| M | 4 | 253 | 4.82 | 257 | 247 | 457 | 95 | 345 | 77 | 1.52 | 4.04 |
| M | 4 | 257 | 4.92 | 245 | 248 | 596 | 178 | 779 | 128 | 1.50 | 4.05 |
| M | 4 | 274 | 5.16 | 267 | 256 | 619 | 155 | 701 | 140 | 1.58 | 4.02 |
| Mean | 222 | 4.29 | 214 | 213 | 473 | 103 | 453 | 80 | 1.75 | 4.08 | |
| SD | 40 | 0.71 | 40 | 35 | 163 | 69 | 220 | 39 | 0.28 | 0.22 | |
Table 1: Results of the two minutes and four minutes all-out tests, peak force measurements and on-water competition time at 500 and 1000 meters (n=10).
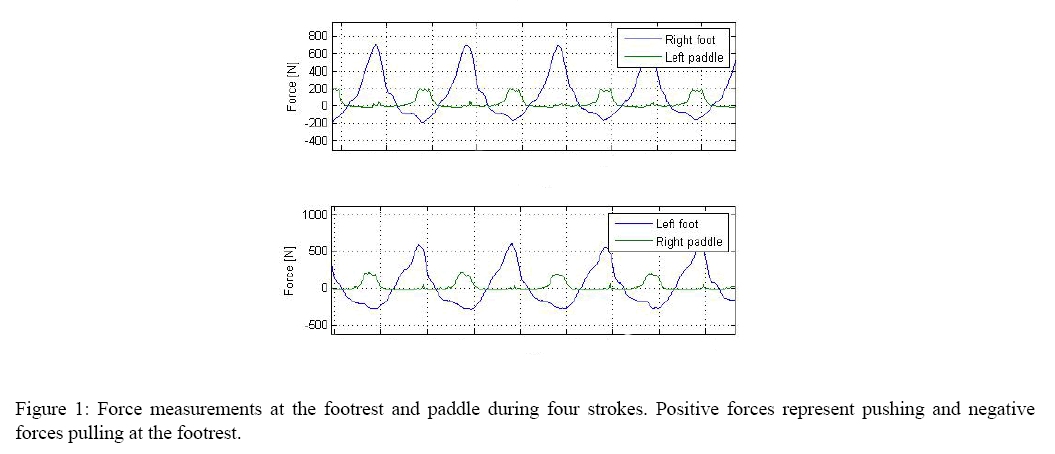
Figure 1: Force measurements at the footrest and paddle during four strokes. Positive forces represent pushing and negative forces pulling at the footrest.
There were also substantial differences between subjects in the force recorded in the paddle. There are considerable differences between left and right sides for some subjects, although mean values show similarities. The athletes generated high forces pushing on the foot-rest, approximately twice as high as the forces in the paddle. The forces recorded during pulling on the foot-rest were approximately one fifth of the pushing forces. When data were dichotomised by peak power above and below 200 W during the all-out test, there were significant differences between groups in VO2 peak (1.23 L/min, p<0.001), paddle forces (Left 58 N, p=0.009; Right 48 N, p=0.023), pull forces on the foot-rest (Left 107 N, p=0.005; Right 50 N, p=0.034) and competition time at 500 (14 s, p<0.001) and 1000 meters (31 s, p<0.016). No statistical difference in push forces on the foot-rest was found between groups. The correlations between measurements of power, VO2 peak, competition time at 500 and 1000 meters, paddle forces and feet forces are shown in Table 2.
| Competition time | |||||
|---|---|---|---|---|---|
| Power | VO2peak | 500 m | 1000 m | ||
| Power | 0.96** | - 0.94** | - 0.63* | ||
| VO2peak | 0.96** | - 0.86** | -0.45 | ||
| Paddle | Left | 0.91** | 0.95** | - 0.77** | -0.3 |
| Right | 0.87** | 0.88** | - 0.73* | -0.34 | |
| Foot Left | Push | 0.52 | 0.36 | -0.58 | -0.54 |
| Pull | 0.79** | 0.69* | - 0.84** | - 0.83** | |
| Foot right | Push | 0.57 | 0.41 | -0.51 | -0.59 |
| Pull | 0.74* | 0.61† | - 0.69* | - 0.67* | |
Table 2: Pearson’s correlation coefficient between measurements of VO2 peak, power, peak forces and on-water competition time at 500 and 1000 meters (n=10).
Paddle forces correlated significantly to power, VO2 peak and competition time at 500 meters but not at 1000 meters. Pulling forces on the foot-rests correlated significantly to power, VO2 peak and competition time at 500 and 1000 meters, whereas no significant correlations were found for push forces on the foot-rest. No significant correlation was found between forces in the paddle and foot-rest.
The multiple regression analysis is summarized in Table 3. VO2 peak was the dominating factor for the power model. Pulling forces on the foot-rest contributed to a smaller amount, less than 4%. If VO2 peak was replaced by paddle force, the fit was almost as good, and the model also included pulling peak force. VO2 peak and paddle force were closely related (rp=0.92, p<0.001).
| Dependent variable Power | ||
|---|---|---|
| Independent variables | Adjusted R2 | P values |
| VO2peak | 0.91 | P<0.001 |
| Pulling force | 0.95 | P=0.029 |
Table 3: Adjusted R2 values and P values between power and the significant independent variables: VO2 peak and pulling peak force (n=10).
The main finding of this study was that the pulling force on the foot-rest during ergometric paddling correlated significantly to power, VO2 peak and on-water competition time at both 500 meters and 1000 meters.
We have for the first time demonstrated that pulling forces at the foot-rest during influence performance during paddling on a kayak ergometer. Similar findings have been described during rowing [16], where mean power increased with pulling forces of the foot stretcher. Pushing forces at the foot-stretcher during rowing have been proposed to relate proportionally to forces at the oar blade [17,18]. We could not demonstrate any significant correlation between pushing forces at the feet and power during kayaking.
In rowing the oars are attached to the boat [19]. This is mechanically different from kayaking, where there is no attachment between the paddle and the boat. In rowing, the forces from the oars act rather symmetrically on the boat and rower and the boat is pushed forward through oarlocks. In kayaking the kayakers themselves will have to transfer the force from the paddle to the boat via the body [6].
Since the force in the paddle blade, that drives the kayak forward, acts at a distance away from the centre line of the kayak a moment must be balanced. The moment may be balanced by a pulling force in the foot away from the active side Figure 1. The magnitude of the moment may be related to the developed power. Thus, a high moment from a high power is dependent on pulling force in one foot.
The force generated by the paddle should to a large extent be transmitted to the kayak through pushing on the footrest. It is therefore somewhat surprising that we did not find any correlation between power and pushing at the footrest. Several factors may explain this. First of all, force is transmitted also through the seat [4]. The variability in the measurements of forces at the foot-rest was considerably higher than in the measurements of power, VO2 peak and peak force in the paddle. The direction of the force applied on the paddle may not be parallel to the frame of the ergometer, whereas the pushing force in the foot-rest is measured in the direction of the frame. The relation between the pushing force on the foot-rest and VO2 peak may also be different in a kayak on water and in an ergometer.
Power had the strongest correlation to competition time in our study Table 2. We therefore performed a multiple correlation with power as the dependent variable. This showed that VO2 peak and pulling forces gave the best fit, explaining 95% of the variance. VO2 peak and paddle force were highly collinear in the multiple regression, and if VO2 peak was replaced by paddle force, a similar result was obtained, still with pulling force at the foot-rest as a significant contributor to power. This points to the importance of VO2 peak and force produced at the paddle for kayaking performance which has been described earlier [5,7].
Even though pulling forces at the foot-rest only explained 4 % of the variance in power in our study, this may still make a difference for elite kayakers where the differences between competitors are small. In highly trained athletes can it be hard to increase VO2 peak further to get advantages during competition [20-23].
Interestingly, the pulling forces are the only indices together with power correlating significantly to competition time at 1000 m (Table 2). Training focusing on using pulling forces at the foot-rest may increase the kayaking performance further. There are some important limitations of this study.
Firstly, the subjects are few, and the results need confirmation in larger materials.
Secondly, the measurements were performed with a kayak ergometer, and the pattern may differ between paddling on a kayak ergometer and on water. It therefore appears important to study forces in the foot-rest during paddling on water. Drag forces [4] do not exists on the ergometer and the forces in the wires connecting the paddle to the fan will not affect the kayaker on the water.
Thirdly, force is transmitted from the paddle to the kayak also through the seat, which we have not analysed in this study. Force measurements in the seats will be necessary for a complete analysis of the biomechanics of kayaking.
To the best of our knowledge we have for the first time demonstrated that pulling forces at the feet relate to paddling performance on a kayak ergometer.
Though we have studied forces at the feet during ergometric paddling, we would assume that forces at the feet may also relate to flat-water paddling. This may have important implications for the training of kayakers in the future.