Research Article - European Journal of Applied Engineering and Scientific Research ( 2022) Volume 10, Issue 2
Received: 21-Jan-2022, Manuscript No. EJASER-22-52001; Editor assigned: 24-Jan-2022, Pre QC No. EJASER-22-52001 (PQ); Reviewed: 04-Feb-2022, QC No. EJASER-22-52001; Revised: 15-Feb-2022, Manuscript No. EJASER-22-52001 (R); Published: 28-Feb-2022 , DOI: 10.36648/2278-0041.10.2.1
Unlike formal mathematical expressions, usually used to process the results of fatigue tests in order to describe the corresponding fatigue curve, it is proposed to base this description on the Daniels Epsilon Sequence (DeS) and its modifications, which describe the incremental accumulation of fatigue damage, controlled by the parameters of the local static strength of the component Unidirectional Fiber Composite (UFC). This makes it possible to predict the corresponding changes in the fatigue characteristics of UFC when the change of components takes place. The DeS-Fatigue_compatible local strength Distribution (DeS_FcD) of UFC components manifested under cyclic loading is introduced. This distribution depends on the static strength in laboratory tests distribution, but does not coincide with the latter. The differences between these distributions demonstrate the specific features of behaviour of the composite components under cyclic loading both in time and depending on the current load value. The numerical examples are given.
Composite, Daniels’ epsilon sequence, Fatigue life, Residual strength
A Unidirectional Fiber Composite (UFC) is usually modelled as a series-parallel system, that is, a sequence of links, each of which is a parallel system of the Longitudinal Items (LIs). The structure of the modern fiber composites is significantly different from the structure of UFS. But a main body of power longitudinal elements usually remains the "power core" of a modern composite material and an interest in the analysis of its properties the influence of its size, dimensions and properties of its components remains.
The breaking of the Weakest Link (WL) (the weakest micro volume) means the destruction of the entire UFC. A large number of publications are devoted to the relationship between the static strength of the UFC and the static strength of the LIs of the WL components. Let us mention the most significant of them.
Peirce [1] gives an approximate formula for the average strength of a bundle of LIs (fibers, bundles, strands) forming the UFC. The normal approximation of the strength distribution law of a parallel system was shown by Daniels [2,3]. His result was refined by Smith already with a reference to the series-parallel system (SPS), definition of which was earlier proposed in [4]. A detail review of the residual strength a given in [5,6].
The relationship between static strength of the specimen and fatigue life of the specimens of the same specimen type is also widely covered in the literature. The history of the study of this issue and a deep analysis are given in the work of Ciavarella [7] where a relatively recently proposed by Kassapoglou [8] model is considered also. Much less attention is paid to the relationship between the fatigue life of the UFC and the static strength of the Longitudinal Items (LI) - WL components. This connection is most naturally seen in the models based on the theory of Markov Chains which was used in Daniel’s function & Daniel’s epsilon [6]. The states of the chain were connected with the items of Daniels Sequence (DS). The probabilities of transitions were expressed in terms of the distribution function of the static strength of the longitudinal components of the UFC and their parameters. Consequently, the number of steps to chain absorption and the corresponding durability of the composite are determined by these parameters. This makes it possible to predict the change in the durability of the composite when its components change.
Using this theory and the Monte Carlo method, allow modelling statistical aspects of the problem,
The model considered in this article is a simplified modification of the previously considered ones. The term "Daniels Sequence" first appeared in the work connection of tensile strength distribution and fatigue life of fiber composite//8th International conference, but the first calculations of such a sequence took place much earlier. In our publication [8-12] it was shown that the use of the Daniels’ sequence allows:
1) To describe the process of step-by-step growth of local stresses in a weak link of the UFC; the graphical representation of this process is similar to the well-known S-shaped curve describing changes in the fatigue process of some physical parameters (Figure 1);
2) To directly relate the number of the DS items (the calculated local stresses) at which the value of DS item tends to infinity with the DS-Fatigue Life (DS_FLf) of composite. This number is a function of the parameters of the Static Strength Distribution of its Component (SSDC) and this allows to do the regression analysis of the fatigue test data and the prediction of the composite fatigue life changes if its component static strength changes. It is the main specific feature and advantage of the DS models;
3) To explain the specific features of the residual strength: a long period of very gradual degradation of strength is suddenly replaced by a sharp drop to zero;
4) To explain the existence of infinite fatigue life, DS_FLf, and the DS_Fatigue Limit (DS_FLt) just as the specific feature of the DS and as a direct consequence of the peculiarity of describing the process of degradation of a composite as a Daniels sequence at sufficiently low fatigue loads.
But there is the shortcoming of the model: if the cycle loads only slightly exceeds the DS_FLt, the predicted DS_FLf is too small. In order to get rid of this drawback without using Markov processes [6], the concept of a Daniels’ epsilon Sequence (DeS) was introduced in unidirectional fibrous composite. Some additional parameter which is denoted by the symbol, was introduced in DeS in order makes it easy to control the value of the calculated DeS_FLf. This parameter takes into account that the “strength less than load” condition is not sufficient to fracture the composite component. It also requires a supply of energy for some time and only a part of the components whose strength is less than the applied load is destroyed during one fatigue loading cycle. The real value, apparently, depends on the parameter of the current cycle, on the frequency of loading, on the structure of the UFC and on the other circumstances.
And here we will use also some additional assumption. The initial number of the LIs, n, in the considered WL of UFC is will be assumed to be equal to infinite number.
In this case we will limit ourselves to analyse only the average values of the fatigue life and the "core" of the degradation process of the fatigue strength of the composite. That's quite enough for a wide range of applications and in the initial period of more "in-depth" research. (If necessary, the assumptions that the value of n is finite, and the strength of each of the longitudinal components is a random variable with a known distribution function, the use of the Monte Carlo method allow to obtain statistical characteristics of the fatigue life see for example modelling of fatigue life of unidirectional fibrous composite by Daniels' epsilon-sequence under random loading [12].
In the following sections of the paper the general mathematical definition of the DeS, the use of it for analysis of the fatigue test data, the prediction of the fatigue life after some changes of the statically strength of the components of the UFC and the following conclusions are discussed.
Daniel’s epsilon sequence
Daniel’s sequence
As it was told already here we consider only one link of the SPS that has , items in general case. The strength of such link was studied by Daniels [2,3]. It is called now the “classical model of bundle of n parallel fibers stretched between two clamps”. In general case, strands or some set of strands can be considered instead of the fibers. Here for all structural items of these types we’ll use more general terms: Longitudional Item” (LI) or just “component”. The connection of the fatigue characteristic of one link and the SPS as a whole is described in fatigue-prone airframes and reliability of composite. We assume that the total load on the link is uniformly distributed among all functional LIs both at the beginning of the test and after the destruction of some of them. The state of the UFC is defined by the number of the intact LIs.
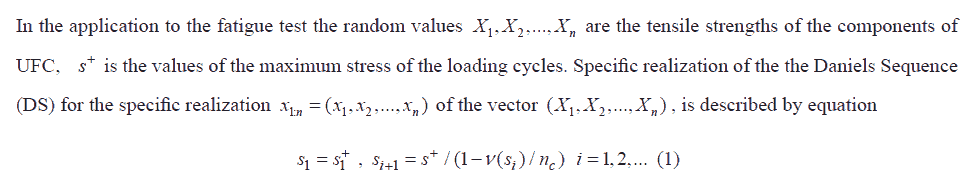
First, we will recall the simplified definition of DS which can be used for procession of fatigue test data and description of fatigue curve. In application to the general parallel system the DS as some mathematical random process is defined by two components: A vector , whose components are mutually independent random variables with the same Cumulative Distribution Function (CDF), and the parameter of the loading process, s+ a more general definition is given in modelling of fatigue life of unidirectional fibrous composite by Daniels' epsilon-sequence under random loading.
Daniel’s epsilon sequence
The modification of the DS, which is defined by the equation

We call the Daniels epsilon Sequence (DeS).
As it was told already, the parameter defines the rate of accumulation of the fatigue damages into one cycle and takes into account the fact that the destruction of all LIs requires both time and sufficient energy supply. The number of such elements, LIs, whose destruction occurs in one cycle, depends on the frequency of loading and other factors.
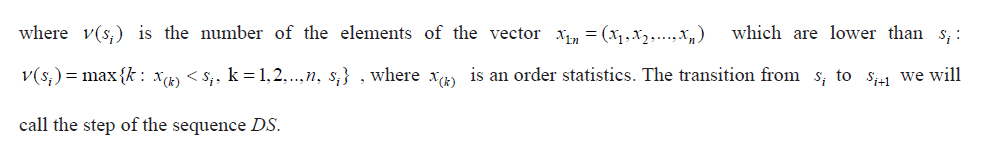
The ratio is the empirical estimate of the cdf, . For the considered here simplified version of the DeS we assume that the dimension of the vector (number of LIs in the considered link) is equal to ifinity so in (1) can be used instead of . In the fatigue test to study the SN curve we are interested only in the case when where is the maximum of the stress cycle. Then the equation (2) can be rewriten in this way
Where ; .s0i+1= s+ / (1 F(si )) i = 1,2,... 0 <ε ≤1
There are two types of the DeS (Figure 1). The first type of it takes place if the parameter is large enough and items of DS has tendency to grow up to infinity.
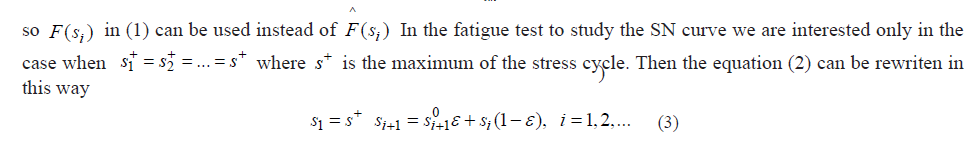
Let for the fixed s+ and some ε the integer function nDeS (s; s+ ,ε )n = 1,2,... , s = s1, s2 ,... ,...determines the number of steps at which the sequence DeS reaches the value s.
An event in which reaches some sufficiently large critical value of we consider as fatigue failure and define the DeS Fatigue Life (DeS_FLf) to be equal to
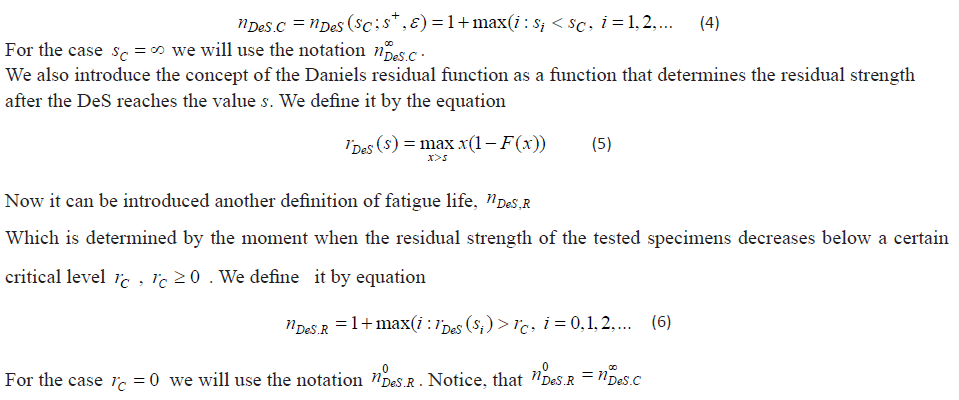
The second type of DeS takes place if the stress s+ is small enough. Then after some number of steps the increasing of the value of DeS items almost ceases in spite of increasing the number of steps up to infinity. The maximal value of cycle parameter s+ for which this event takes place we considered as the Daniels fatigue strength (DFSt) or the Daniels Fatigue Limit (DFLt)sD . The fatigue limit is determined by the maximum load value s+ at which equality si*+1=si*can occur for some final i*.
In reliability of fatigue-prone airframes and composite materials it is shown that regardless of the value of ε,0≤ε≤1
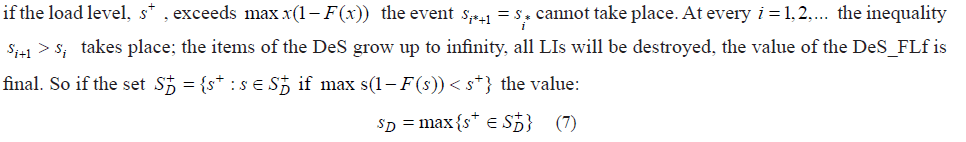
Can be used as the definition of the Daniels Fatigue Limit (DFLt).
It is necessary to note the obvious. The values sDof in (7) and rDeS(0)in (5) coincide with the value of the static strength of the “classical model of bundle of n parallel fibers stretched between two clamps” predicted by Daniels [2,3]. So the DFLt differs from predicted by Daniels static strength only if the definition of the set SD+will be made for the distribution different from the cdf which is used for calculation of the Daniels static strength.
So in following for calculation of the DFLt we use some specific cdf FL(x)of the local strength of the LIs working as part a “weakest link” of the UFC. ( Indeed, there are a lot of the reasons for the difference between and : the length of the LI in the "weakest” link does not match the length of LI for laboratory static strength tests, a structure of LI in the frame of the link has a special support conditions, … ). Later on it will be shown that processing the test data we can find the function ε=ε(s+) in such a way that the DeS_FLfs,n∞DeS_c or n0Des_r , will be equal to the corresponding test fatigue lifes. This function together with the equations (3) and (7) gives the description of fatigue curve which is directly related to the parameters of the local static strength distribution of its components.
Next, we will analyze two numerical examples using the considered mathematical apparatus (using the DeS approach) for processing the results of fatigue tests in order to:
1.Establishing a connection between the description of the fatigue curve of the composite and the parameters of the distribution of the local strength of its components and
2.For the analysis of its residual strength.
When considering these examples, the special concept of a DeS Fatigue Compatible local strength Distribution (DeS_FcD) of LIs introduced by us will be used.
Application to the fatigue curve analysis
In this part of the paper, we will review the analysis of the data on fatigue tests of composite samples and on the static strength of its components presented in [11].
Two simple assumptions help to explain (and to model) why during fatigue tests the composite collapses at the load significantly lower than its static strength:a) In the link under consideration, the local strength is kL,kL≥1 times less than in other links.;b) In the link under consideration, the local stress is kC,kC≥1 time greater than in other links, kC≥1 .
Let's consider the difference between the influence of coefficients and on the results of analysis of fatigue test data. For simplicity we assume that is equal to 1. And instead of the symbol DeS, we'll use the DS symbol. Here we study 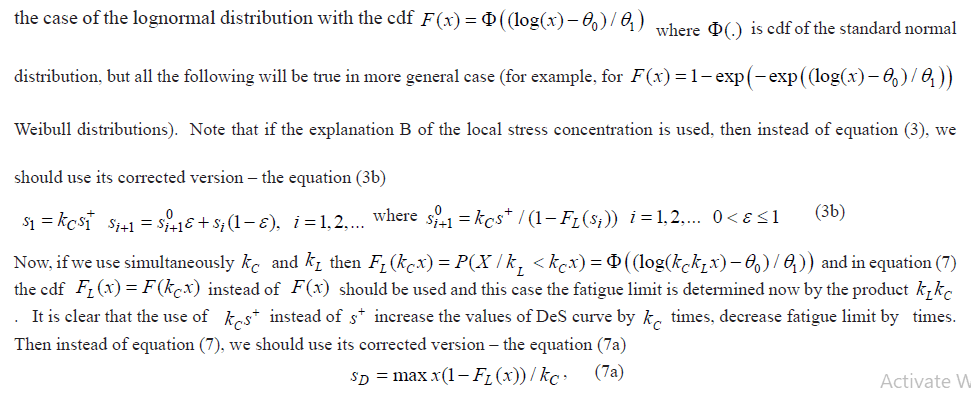
Of course DeS_FLs, nDeS,C will decrease also. In order to see the difference between the influence of kC and kL at different values the calculation of DeS curves and the corresponding DeS_FLfs for two pairs: ( kC=1.75 kL=1.0 ) and ( kC=1.0 kL=1.75 ) with two epsilon values: ε=0.00001 and ε=0.000001 were made. In Table 2 in work [13,14] the results of the carbon fiber strand specimen tensile test. The results of the fatigue test at an approximately pulsed ( smin/smax=0.1) load on CFRP specimens are presented. The results of processing the data from static strength tests of carbon fiber strand specimens, including testing hypotheses about the type of distribution law using OSPPT and ρ criteria a family of weakest link models for fiber strength distribution show that the hypothesis about the lognormal distribution (normal distribution on a logarithmic scale) was more plausible than the Weibull distribution [13]. For the cdf F(x)=Φ((log(x)—θ0/θ1)) the following parameter estimates are received: θ0=6.48 , θ1.=0.168 The results of calculation DeS curves and for 600 are shown in Figure 1.

Figure 1. DeS and nDeS (sC ; s+ ,ε ) for load levels: 333.5; 323.7; 309.7; 290.1; 279.6; 270.8 ; 250.2 MPa .
It turned out that at high stress loads there is some small difference in the values of DeSFLf for two pairs: ( kC=1.75 kL=1.0 ) and ( kC=1.0 kL=1.75). But this difference disappears and for and for ε=0.000001 if the stress is small. So if we need to know only the fatigue curve, there is not much difference to use or parameter, but if the residual strength data is also analyzed at the same time, it is more convenient to use parameter assuming parameter to be 1 because, as it was told already the equation (5) defines local residual stress corresponding to cdf There is a need to investigate the influence of the parameter more closely. In first and second lines of the Table 2 the results of the fatigue test are shown [11]. The calculation results corresponding to for and different values are presented below.
| 480 | 380 | 345 | 290 | |
| Test (cycles) | 5313 | 95760 | 158489 | 1772812 |
| DeS_FLf | ||||
| 0.168 | 5500 | 95900 | 158600 | 1772800 |
| 0.015 | 4800 | 88100 | 164300 | >4000000 |
.png)
Sometimes we need only approximate general description of the fatigue curve and a more accurate description only in some interval close to some specific value of stress . If this interval is not too wide, then to describe the corresponding fatigue curve it is possible to limit ourselves to using only one value . This remark is particularly useful if we are interested in a relatively small interval near the fatigue limit. Example of such calculation is shown in the lower line in the Table 2. The corresponding fatigue curve (test data and result of calculations) is shown in Figure 2. The calculations were carried out assuming:

Figure 2. The approximate fatigue curve;- calculation; + - test.
1) The lognormal distribution of the static strength of the longitudinal components with the cdf , parameters :
F(x)=Φ((log(x)—θ0/θ1)) θ0=6.48 , θ1.=0.168
Of course, the fitting can be improved if the calculation of for several stress levels will be performed. As a development of the model we can go further and offer some model which allows estimating the parameters of a fitting, minimizing the following value:
.png)
regression methods. It seems promising to study the connection of the function with the mathematical description of the phenomenon of the hysteresis, a mathematical model of which is proposed, for example, in models of reliability of composite. This model is based on approximation of a strain-stress curve of a composite by an equation
.png)
fatigue loading cycle and the curve ). It seems plausible that the larger this area, the larger the value of the function. For the mathematical description of all these reasoning, of course, in the future it is necessary
to conduct special research}.
- calculation; + - test.
The result presented in Figure 2 appears to be acceptable for many applications. As it is already mentioned, it can be improved,
The Daniels_epsilon_sequence-fatigue_compatible distribution of the local strength
Using the corresponding value of the parameter we can obtain arbitrarily large calculated fatigue life. But the question appears: is there such a cdf, we denote it by , that the calculations using the equation (3) and a pair ( , ) give the same results as when using the same equation but the value and some specific . The function should correspond to the equation

The function is called here the Daniels_epsilon_Sequence-Fatigue_compatible (DeS_FcD) distribution of local strength. We would have the same results of the calculations of the fatigue life, DeS_FLf, using this function in frame of DS approach (using and the function ) and in frame of DeS approach (using some and the function ). Exampls of in comparison with are shown in Figure 3.

Figure 3.The DeS fatigue equivalent distribution nullctions FDes (.) of local strength and con·espouding cdf FL ( .) for Kc = 1 and two levels of ε; and s+ : a l . ε = 0.1 ., s+ = 200 b l. ε = 0.00001. s+ = 200 a2 ε = 0. 1. s- = 100 b2 ε =0.00001 . s+ = 100
We see a big difference between and , especially with small values of the argument. The function, of course, depends on , but differ from it and shows how the probability of destruction of longitudinal components depends on specific levels of load and the rates of its change during one cycle.
Approximation
The true way to calculate the DeS_FLf is the use of requrent formule (3) and its modifications. It is easy if the DeS_FLf is not too large. In other case it is very exhausting work. The following approximation can be used.
.png)
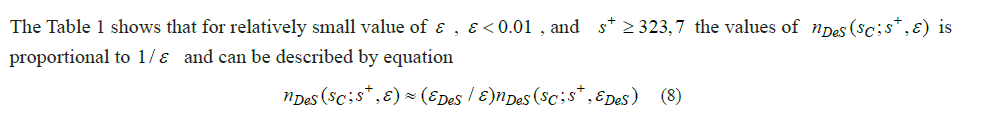
Let us note that the integral can be used for approximate calculation of the and then for calculation of the approximate function which is necessary for fitting real test fatigue lives. The possibility of using the obtained approximation formulas is most significant for simplifying the assessment of DeS_FLf at stresses not too exceeding the fatigue limit, when their calculation using equation (3) is weighty tedious.
Residual strength
Now we consider the processing of the result of the fatigue test in which the data not only about the fatigue life but about the residual strength was obtained. The test data was taken from tables 1-3 in Ref. [14] concerned T300/934 graphite/epoxy laminates with lay-up. In Table 1 of this paper the static strength of 25 specimens, in Table 2 numers of cycles to failure at three different stress levels (namely: for = 400, 380 and 290 MPa, ) and in Table 3 two sets of residual strength data are reported for 15 and 18 specimens subjected to cyclic loading up to 3,640,000 and 31,400 cycles at a maximum stress, = 290 and 345 MPa respectively.
The tested specimens are not the UFC. But we suppose that the failure of this composite takes the place after the failure of some Weak Link (WL) which is a bundle of the parallel LIs. We make (enough rough) assumption that this WMV is a UFC - equivalent which has the same distribution of fatigue strength. In work [14], there is no information about the static strength of the composite components. We will use the data which we have used already in the previous example in which carbon fiber longitudinal elements were also used for the test specimens. This, of course, means that the following should be considered only as an example of the application of the technique in question, and not as a study of a specific experiment. We accept also the lognormal distribution of the static strength of LIs with the same values of parameters as in the previous section.
After transformation of equation (11) we can calculate the value of

Which should ensure the equality of the calculated DeS_FL and the corresponding test value for specific load level. For two load levels, 345 and 290 MPa, we have got the corresponding values : 0.00000242 and 0.00000464. Then using these values further in equations (3b), (5) and (8), we get the results which is shown in the Figure 4. In the left part of this figure, for the load level of 345 MPa, the following is shown : a1) the DeS curves (-), calculated (--) and test residual strengths (+); a2) the cdf (.) LF and the cdf (.) DeS F; a3) “the derivatives” of these functions (df= ; def= , ). The right part of the figure shows similar results for the load level of 290 MPa. Let us note that the DeS_FcD, , provides another measurement of differences in the static strength distributions of separate longitudinal components, , and inside the structure of the composite.

Figure 4.Daniels' sequences (DeS) , calculated (--) and test residual strength (+) (a1, b1); cdf and Daniels'- equivalent cdf (a2, b2) and the "derivatives" of these functions (a3, b3) for two load levels 345(a) and 290(b) MPa.
On the sub-plots a1 and b1, we see that equation (5) for the assumed distribution function gives a plausible description of the residual strength. It is useful to note: the DeS curve rushes to infinity and the calculated residual strength rushes to zero at the same number of cycles. Since equation (10) is suitable only for relatively low load levels, for levels 400 and 380 MPa, the values of were selected from the equation of the coincidence of the calculated and tested values of durability: 0.0000181 and 0.00000166. The final calculated fatigue curve is shown in Figure 5.

Figure 5. DeS_SN, log10DeS_SN (-) and test data,
Prediction
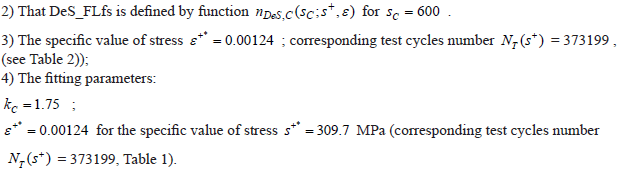
The study of the possibility and accuracy of the fatigue life changes prediction with the changes in the static strength of composite components using the DeS approach requires a special experiment. And this is the task of subsequent research. Here we will limit ourselves to analyzing the effect of reducing the spread of static strength, more precisely, the effect of reducing the parameter on the calculated average fatigue life at the level of loads considered in the last example. A comparison of the results of the the calculations DeS_FLf for the two different values but the same all the other parameters is shown in Table 1.
|
|
|||||
|
|
|||||
| S | 333.5 | 323.7 | 309.7 | 290.1 | |
| Test (cycles) | 4928 | 115733 | 373199 | 1004800 | |
| DeS_FLf | |||||
| 0.1 | 1 | 3 | 5 | 16 | |
| 0.01 | 8 | 19 | 47 | 154 | |
| 0.02 | 36 | 91 | 231 | 766 | |
| 0.00001 | 7038 | 18129 | 46031 | 153012 | |
| 0.00123860 | 57000 | 147000 | 373000 | 1237000 | |
We see a significant increase in DeS_FLf when the load is close to the fatigue limit. But with a relatively high load, the decrease of led to a slight decrease in DeS_FLf. Recall that the same effect applies to calculating the average static strength. For the studied here lognormal distribution the average static strength is equal to . These conclusions should be taken into account in the design of a new composite which is similar to the studied here.
Unlike formal mathematical expressions, usually used to process the results of fatigue tests in order to describe the corresponding fatigue curve, it is proposed to base this description on the Daniels Epsilon Sequence (DeS) and its modification, which describe the incremental accumulation of fatigue damage, controlled by the parameters of the local static strength of the component Unidirectional Fibre Composite (UFC). This makes it possible to predict the corresponding changes in the fatigue characteristics of UFC when the change of components takes place. Numerical examples confirmed the possibility of obtaining the desired result.
The DeS-Fatigue_compatible local strength Distribution (DeS_FcD) of UFC components manifested under cyclic loading is introduced. This distribution depends on the static strength in laboratory tests distribution, but does not coincide with the latter.
It was shown that the use of the DS approach and FDeS (.) is tantamount to using the DeS approach and the distribution function of the static strength of the components, FL(.), whose parameters are obtained from the results of the tests of composite components for static strength. Comparison of the functions FL(.) and FDeS (.) shows the difference between the "real momentary characteristics” of the strength manifested during fatigue tests and manifested during static strength tests.
The main direction of the development of the considered model is the search for the function. This problem has already been discussed by us in the section 3.1. If there is necessity to study the scatter and the spred of fatigue life the previously considered calculations using the Monte Carlo method should be carried out for a finite number of components in one link , as it is done, for example, in modelling of fatigue life of unidirectional fibrous composite by Daniels' epsilon-sequence under random loading. The relationship between the fatigue characteristics of an individual link and the composite as a whole is considered in detail in models of reliability of composite.