Research Article - Journal of Natural Product and Plant Resources ( 2018) Volume 8, Issue 1
In this work, an attempt has been made to replace wood as raw material by agricultural waste, apart from that
exploring the possibility of using enzymatic hydrolysis in place of acid hydrolysis for preparation of Nano cellulose
(NC). The morphology of prepared Nano cellulose was observed under polarized microscope and SEM, uniform
distribution of rod shaped, micro and nano sized cellulose fibers were observed. The average size of the NC as
measured in zeta particle size analyzer was 53.94 nm and the average length was 551.4 nm. FTIR analysis confirms
the presence of cellulose group in the extract. The rheological behavior of banana stem powder and NC indicates
decrease in viscosity from 1.7 η to 0.6 η and in degree of polymerization from 323 to 116, respectively. X-ray
diffraction and TGA analysis of both raw banana stem and extracted NC powder shows significant increase in
crystallinity and thermal property.
Banana stem, Characterization, Enzyme, Nano cellulose, Rheological behavior
Cellulose is a complex carbohydrate, (C6H10O5)n that is composed of glucose units, forms the main constituent of cell wall in most of the plants, and is important in the manufacturing of numerous products [1,2]. Cellulose is the primary structural material of the cell walls of higher plants and is a basic constituent of all plant life. It is the world’s most abundant organic biopolymer with an estimate of more than 1 × 10¹¹ tons being produced on land and in water each year on our planet. One of the important recent developments in the area of bio-based materials is the production of Nano cellulose [3].
Nano cellulose is a term referring to Nano structured cellulose. This may be either cellulose nano fibers (CNF) also called micro-fibrillated cellulose (MFC), nano crystalline cellulose (NCC) or bacterial Nano cellulose. Conventional processes of producing Nano cellulose are energy intensive, environmentally hazardous and face problems of environmental incompatibility [4]. This process utilized the cellulase enzyme secreted by microbial consortium. Cellulase enzyme produced by various microbes, with its proven biotechnological advances in various fields, will be of immense use in the production of NCC. Meanwhile, as a biological catalyst, action of microbial enzymes reduces the energy requirement for cellulose hydrolysis [5].
Agricultural waste is also an abundant resource of cellulose, agro-wastes like rice husk have 43.33%, maize cub 62.96%, banana stalk 47.36% and groundnut shell 65.20% as against the alpha cellulose content of wood which is 63%. Use of such products in place of wood would avoid de forestation and desertification and their consequences [6,7]. Exploitation of the agricultural waste will be significantly beneficial to the environment and bring additional profits to farmers [8].
Banana is one of the important fruit crop cultivated in tropical parts of the world. Cellulose is the major component of the banana fiber [9]. The highest cellulose content was recorded in Nendran peduncle fiber (60.27%) followed by Nendran pseudostem fibre (59.23%). Basarai, Lokhandi, Robasta, Shreemanti and Grand Naine are some of available type of banana plant at India [10]. Cellulose obtain from such banana plant can be used for production of micro cellulose as well as nano. From pseudostem threads are obtained and used for making rope and cloths Banana fiber can be used as raw material for industry for production of range of products like paper, cardboards, tea bags, currency notes and reinforced as polymer composite in high quality dress materials [11].
Earlier we have reported acid hydrolysis method for the preparation of Nano cellulose [12,13]. Looking into the huge potential of Nano cellulose fibers, the objective is to explore novel commercially viable technique for extraction of Nano cellulose using eco-friendly and sustainable, green biogenic method.
Materials
Raw banana fibers, collected from Navsari Agricultural University, Gujarat and Trichoderma ressei based cellulase enzymes were used as raw material for the preparation of Nano cellulose.
Experimental methods
Pretreatment of banana stem
Procured raw banana fibers were subjected to alkali treatment with 5% (owm) of caustic soda solution along with 2% (owm) of nonionic detergent (sodium Lauryl sulfate). Alkali treatment was carried out at 80°C for 1 h on a gas burner further banana fibers were washed properly with water repeatedly. Further bleaching treatment was carried out in two stages as per following formulation:
Stage I
| NaOCl (4% w/v) | Na2CO3 | pH | Temperature | Time | M:L:R |
|---|---|---|---|---|---|
| 20 gpl | 10 gpl | 10.5 | Room Temperature | 1 h | 1:20 |
Stage II
| H2O2 (50% ) | NaSiO3.9H2O | Na2CO3 | pH | Temperature | Time | M:L:R |
|---|---|---|---|---|---|---|
| 20 gpl | 20 gpl | 10 gpl | 10.5 | 80°C | 1 h | 1:20 |
Finally washed thoroughly with water, neutralized using dilute hydrochloric acid (1%) and dried under ambient condition.
Optimization of process and preparation of nanocellulose
For the preparation of Nano cellulose, process optimization was carried out for concentration of enzyme (owm) and duration of treatment. Other conditions like pH and Temperature were kept constant as prescribed by company (pH 5 ± 1 and temperature 60 ± 5°C).
To optimize the concentration, different baths containing varied percentage of enzyme, i.e., 0.5, 2.5, 5.0, 7.5 and 10 (owm) were prepared, keeping liquor ratio 20:1 and other parameters constant for five days.
To optimize duration of treatment, different baths containing 5% enzyme (owm), liquor ratio 20:1 and other parameters constant were prepared for 1 to 10 days. The process was optimized in terms of yield.
After completion of process (Figure 1), the resultant solution was sonicated for 15 min and filtered through Whatman filter paper no. 1 to remove larger size particle. The filtered solution was then centrifuge up to 9000 rpm and Nano cellulose powder was separated and freeze dried. The percentage yield and percentage weight loss was calculated by using initial and final weight of cellulose.
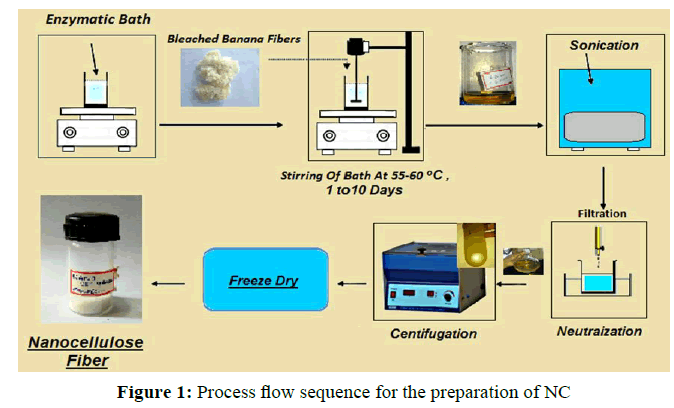
Figure 1: Process flow sequence for the preparation of NC
Characterization of nanocellulose fiber
Viscosity and degree of polymerization (DP)
DP of the Nano cellulose fiber was determined from the values of intrinsic viscosities determined in 0.75 mol/l cupriethylenediamine (CED) with an Ostwald viscometer. Intrinsic viscosity was determined by the following equation:
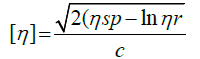
Where, [η] is the intrinsic viscosity of the solution, ηr the relative viscosity calculated using equation ηr=t/t0, where t and t0 are the efflux times for the cellulose solution and CED solvent, ηsp the specific viscosity and C is the concentration of the Nano cellulose samples. All experiments were performed at 30°C with a pure solvent as a carrier. The average degree of polymerization (DP) of the cellulose preparations was estimated according to the formula of DP0.90=1.65[η] /ml·g-1, where the [η] is the intrinsic viscosity of sample dissolved in CED hydroxide solution. The molecular weight (MW) of the cellulose preparations was calculated based on the formula of MW=162*DP, where the 162 Da is the molecular weight of an anhydroglucose unit (ASTM-D795-96, 2001).
Size and size distribution
The particle size and size distribution of nano-particle were measured using Malvern particle size analyzer. Nano celluloses were diluted in deionized water at pH 7.0 at room temperature and mean diameter (Z-average) was calculated.
Morphological analysis
The morphology of prepared nano cellulose fiber was observed under polarized microscope (RADICAL, RXLr-4IT). The sample was also observed using scanning electron microscope, Model JSM-5610 LV Japan under vacuum. The elemental analysis of the same was performed on scanning electron microscope (SEM) using Oxford Inca Software.
FT-IR spectral analysis
The chemical composition was examined using FTIR on FTIR 8400S spectrophotometer (Shimadzu, Japan) using the Kbr pellet method.
X-ray diffraction pattern
The X-ray diffraction patterns were obtained using diffractometer D8 advance with CuK α radiation (λ=1.54 Å). Crystallanity index was calculated based on the Segal’s empirical method using the equation:
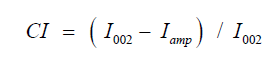
Where, CI is crystallanity index, I002 is maximum peak lattice diffraction and Iamp is intensity if diffraction attributed to amorphous cellulose, i.e., intensity at 18° for cellulose fiber. Integration of crystalline reflection was carried out with Origin Pro software.
Thermal analysis
The thermal decomposition behavior of the materials was measured by thermo gravimetric analyzer (TGA) (STA 449 F3 Jupiter with ASC, NETZSCH-Geratebau Gmbh Germany). Tests were done under nitrogen condition at a scan rate of 10°C/min over a temperature range of 23 to 600°C. The weight change was recorded as a function of the heating temperature.
Process efficacy and characterization of Nano cellulose extracted from banana stem was performed. The rheological properties were characterized by measuring viscosity and degree of polymerization. The size, shape and chemical composition were evaluated by particle size analyzer, SEM, EDX, FTIR and XRD analysis techniques and the thermal property was studied by TGA analysis technique.
Effect of preparatory process
Banana fiber in its raw form contain several impurities, i.e., lignin, gum and many other which has to be removed by sequence of pretreatment. After these pretreatments weight loss of banana fiber was calculated. The weight loss after each pretreatment is shown in the Table 1 in terms of percentage weight loss.
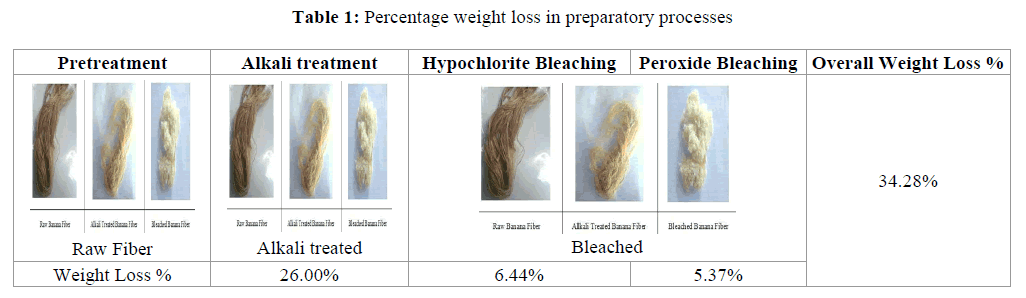
From the Table 1, it can be seen that the maximum weight loss occurs after alkali treatment, i.e., 26%. After that the weight loss during hypochlorite and peroxide bleaching process was less than 12% of overall weight loss was 34.28%. The maximum weight loss occurred during alkali treatment may be due to the removal of lignin, gum, extracts and pectin content of the fiber, which gets soluble in alkali. In case of bleaching process, only coloring matters are removed, resulted in less reduction in weight. The bleached banana fiber was than treated with enzyme to convert it in nano size.
Effect of Trichoderma ressei enzyme concentration
The concentration of Trichoderma ressei enzyme was optimized. The optimized concentration was selected on the bases of maximum yield of NC. Percentage yield after each treatment is shown in Figure 2, it can be seen that the increase in concentration of enzyme in bath resulted in remarkable increase in the % yield up to 5% (owm) but afterwards (i.e., at 7.5 and 10% owm concentrations) the yield remain almost constant. So, for the further investigation 5% (owm) concentration of enzymes was selected as optimized concentration.
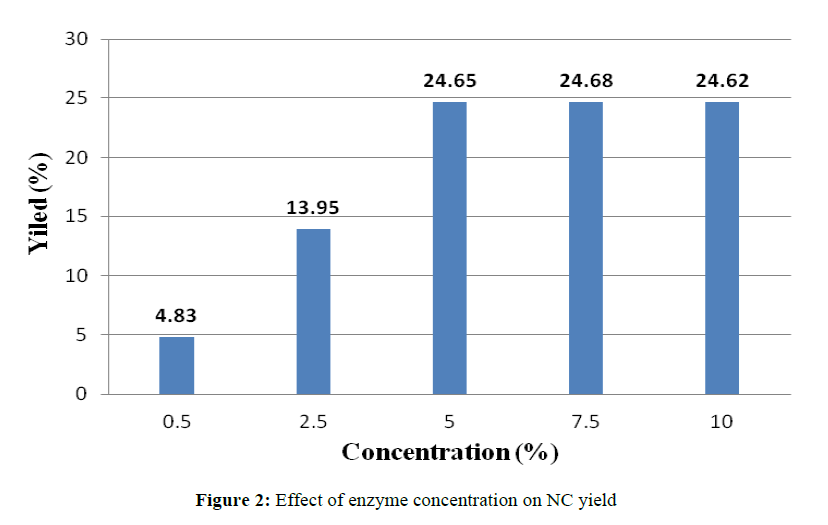
Figure 2: Effect of enzyme concentration on NC yield.
Effect of time of treatment
Results shown in Figure 3, maximum percentage yield, i.e., 24.18 of NC was obtained from bath treated for 7 days. The yield remains almost constant and no significant change was observed for 8, 9 and 10 days of treatment time. It was selected as optimized time for the treatment and used for the further investigation.
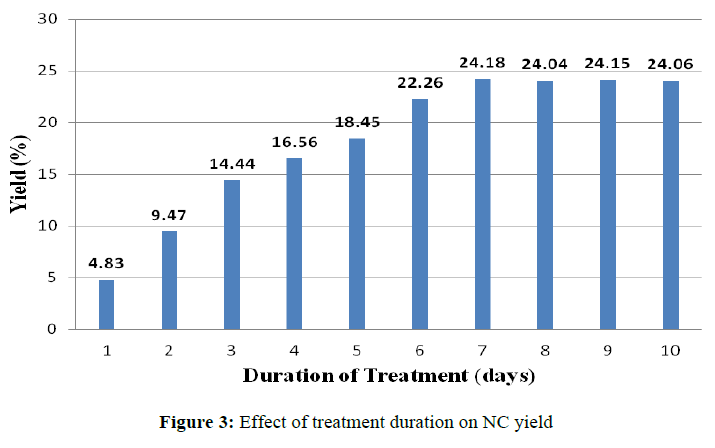
Figure 3: Effect of treatment duration on NC yield.
Viscosity and degree of polymerization (DP)
DP of the Nano cellulose fiber was determined from the values of intrinsic viscosities determined in 0.75 mol/l cupriethylenediamine (CED) with an Ostwald viscometer. Table 2 shows the intrinsic viscosity (η), degree of polymerization (DP), and molecular weight (Mw) of bleached and NC from banana fiber. It can be seen from the results that the intrinsic viscosity, degree of polymerization and molecular weight of the NC reduced compared to the bleach banana fiber.
| Fiber Stage | Viscosity(η) | DP | MW/g·mol-1 |
|---|---|---|---|
| Bleached Banana Fiber | 1.7 | 323 | 52,003 |
| Nanocellulose from banana fiber | 0.6 | 114 | 18,354 |
Table 2: Viscosity, degree of polymerization and molecular weight of cellulose nano fibers.
This is due to enzymatic hydrolysis of large cellulose chain into very small cellulose chain units. It is found that the initial DP of bleached Banana fiber was 323 while enzymatic hydrolysis breaks it to 114 and thus reduces the molecular weight accordingly.
Particle size analysis
Nano cellulose fiber prepared by bio-reduction technique was characterized for their size, and size distribution analysis. The particle size and size distribution of NC were analyzed on Malvern instrument. The prepared NC fibers were dispersed in water and sonicated for 5 min. Figure 4 shows the size distribution of Nano fibers by intensity and corresponding data are given in Table 3.
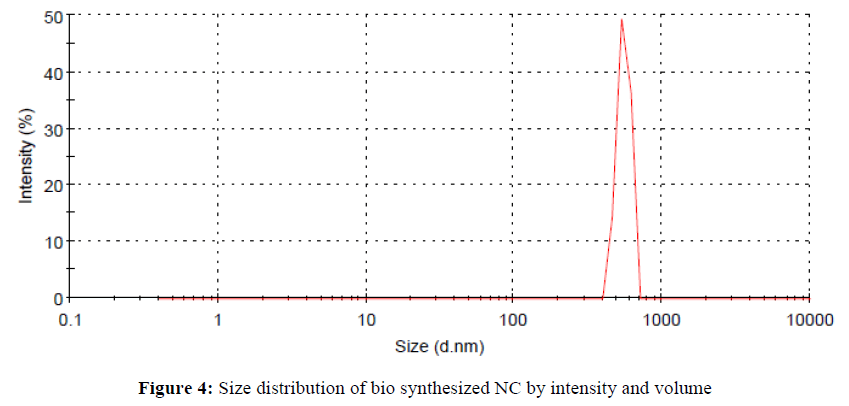
Figure 4: Size distribution of bio synthesized NC by intensity and volume.
| Size Distribution By Intensity | Z-Average (nm) | Size (nm) | Width (nm) | % Intensity | |
|---|---|---|---|---|---|
| Material RI: | Dispersant RI: | 1546 | 551.4 | 53.94 | 100.0 |
| 1.50 | 1.33 | ||||
Table 3: Results of particle size and size distribution by intensity
A narrow peak at around 551.4 nm arises from the dispersion. From the peak position and corresponding values in Table 3 the Z-average diameter of extracted NC is 1546 nm. It is also evident from the particle size analysis that width of NC was 53.94 nm and the average length of the prepared material was 551.4 nm with polydispersity index (PDI) of 0.747.
Morphological analysis
To observe surface morphology of NC polarized microscope and SEM techniques were utilized. The shape and surface of NC are shown in images captured at various magnifications.
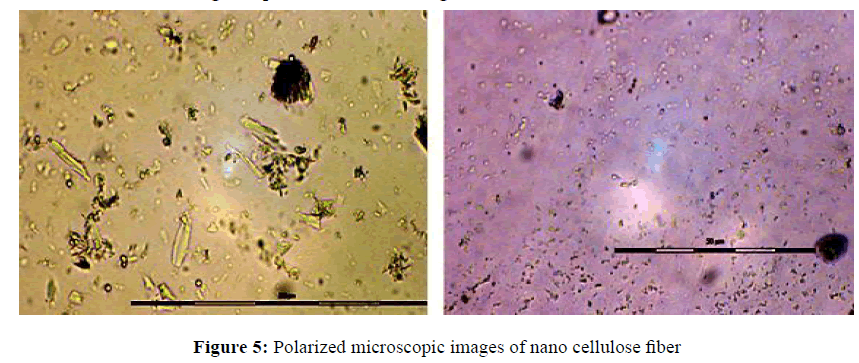
Figure 5: Polarized microscopic images of nano cellulose fiber.
Figure 5 shows polarized microscopic images of NC. From the images and the scales provided within the picture shows NC fibers having approximately diameter within nanometer scale and length within the range of 3-7 μm scale. From the picture it can also be seen that the prepared NC are well separated and having rod like structure.
SEM analysis
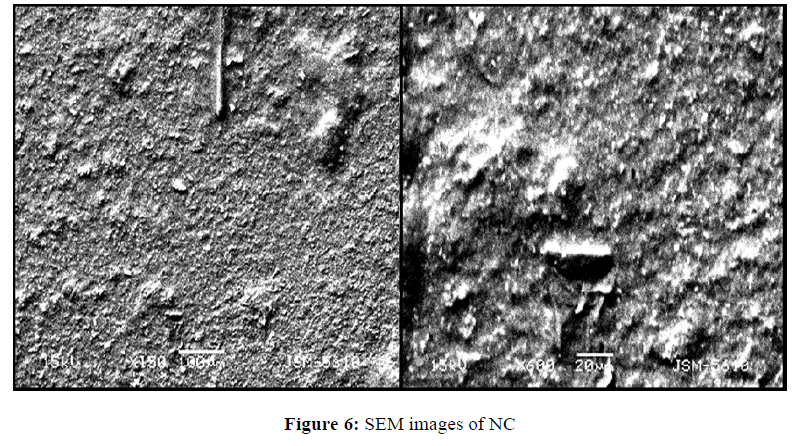
Figure 6: SEM images of NC.
SEM images of enzyme hydrolyzed NC fiber samples are shown in Figure 6. It clearly shows the shape and size distribution of the nano sized celluloses. The isolated individual crystallites from micro fibrils are having approx lengths of <20 μm and diameters of >50 nm as seen from the images. SEM images also revealed that the NC was dispersed uniformly showing a needle shaped rod like structures.
Elemental analysis by Oxford-Inca software (EDS)
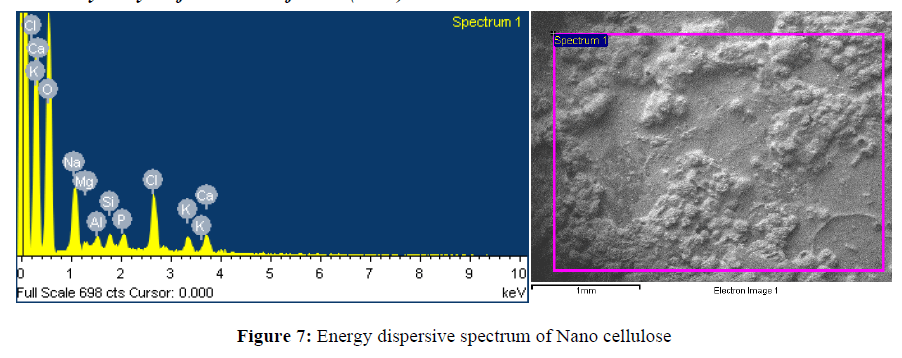
Figure 7: Energy dispersive spectrum of Nano cellulose.
The energy dispersive spectrum (Figure 7) revealed the clear identification of the elemental composition profile of the particles present in the prepared NC. The EDS spectrum showed high peaks for oxygen and calcium signals other than carbon. The vertical axis shows the counts of the X-ray and the horizontal axis shows energy in keV. Peaks for Na, Mg, Si, Al, Cl and K were also observed which may be contributed due to the impurities present in banana fiber.
FTIR analysis
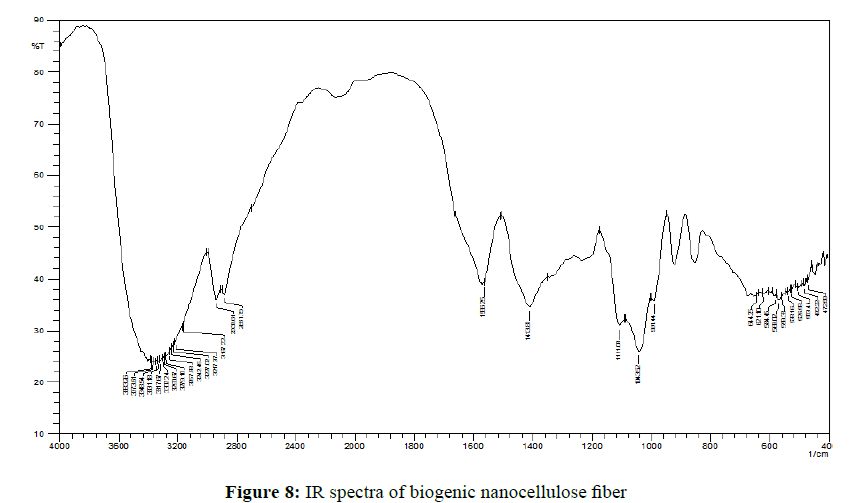
Figure 8: IR spectra of biogenic nanocellulose fiber.
The IR spectra of NC are shown in Figure 8 and the corresponding peaks are presented. The Nano cellulose IR spectrum has shoulders within 1000-1120 cm-1 represents of C-O stretching. The peaks at 2800-3100 cm-1 are attributed to the H- bonded,-OH stretch of cellulose and C-H stretching respectively while the prominent peak at 3250-3400 cm-1 correspond to strong O-H stretching of intermolecular hydrogen bonding. The analysis of all peaks present suggests that the sample powder is cellulose. From the FTIR analysis it has been concluded that there is a reduction in the quantum of binding components present in the fibers due to the process of steam and chemical treatment.
As per the literature the banana raw fibers have a characteristic peak in between 1730-1740 cm-1 and 1200-1300 cm-1 These peaks are chiefly responsible for the hemicelluloses and lignin components. These characteristic peaks are completely absent in the final NC fiber.
Analysis of structural properties by X-ray diffraction (XRD)
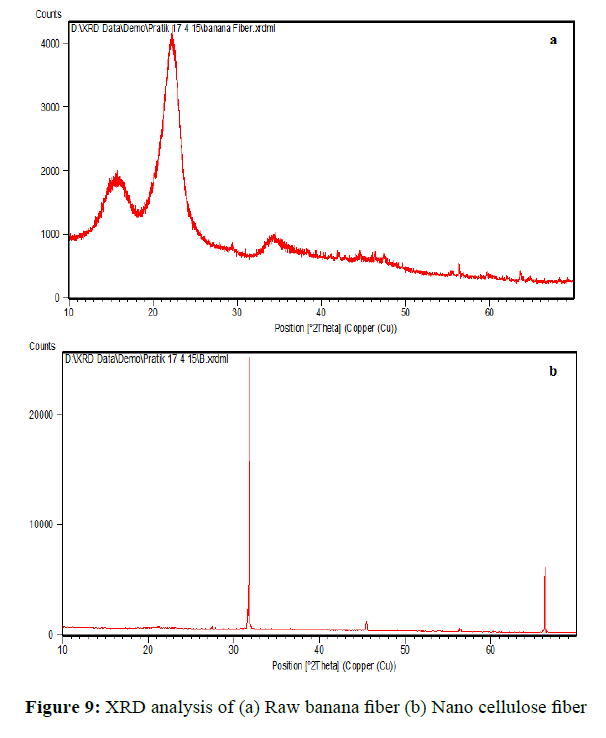
Figure 9: XRD analysis of (a) Raw banana fiber (b) Nano cellulose fiber.
The crystalline nature NC fiber and bleached banana fiber were studied with the aid of X-ray diffraction as shown in Figure 9 For cellulose, peaks were Scattering angle (degrees 2 theta) observed at 16 to 22 and 32 to 35 degrees two theta. Figures 9a and 9b show the X-ray diffraction analysis of the raw banana fiber and NC fiber, respectively. On removing the non-cellulosic constituents of the fibers by chemical treatment, the degree of crystallinity and crystallinity index is changed. The fiber constitutes crystalline and amorphous regions.
The degree of crystallinity, i.e., the amount of crystalline cellulose present in a cellulosic fiber cannot be exactly defined, as neither the crystalline portions are perfect crystals nor the Nano crystalline portion completely disordered. Both, raw banana fiber and nano banana (cellulose) fiber samples exhibited a crystalline structure, showing diffraction peaks at 2θ=15.26, 16.41, 22.15 and 34.58, which can be assigned to the crystal planes (-110), (110), (200) and (004), respectively, and 2θ=14.93, 27.41 and 31.78, which can be assigned to the crystal planes (-110), (200) and (004), respectively. This indicates native cellulose, which is cellulose I as reported by Li [14] (Table 4).
| Fiber Stage | Crystallinity Index (CI) |
|---|---|
| Raw Banana Fiber | 25.63% |
| Nanocellulose From Banana fiber | 78.58% |
Table 4: Evaluation of crystallinity index
Nano cellulose fiber presented a higher crystallinity index (CI) than the raw banana fiber due to the disruption amorphous holocellulose surrounding and embedding the cellulose crystallites formed by well-organized glucose chains [15]. The increase in crystallinity from 25.63% to 78.58% time was also due to the refining, sonication and acid hydrolysis.
Evaluation of thermal property
Thermal decomposition parameters were determined from the TGA curves as described below at a heating rate of 5°C/ min. The TGA curves of the raw, bleached banana fiber are shown in Figure 10. Here a small weight loss was found in the range of 40-120°C due to the evaporation of the humidity of the materials or low molecular weight compounds remaining from the isolation procedures. Due to the differences in the chemical structures between hemicelluloses, cellulose and lignin, they usually decompose at different temperatures. Many studies related to the decomposition of lignocellulosic materials can be found in specific literature. In the thermal analysis, cellulose decomposition started at 310°C and persisted until 400. The TGA results of raw banana fiber, bleached banana fiber and nanocellulose producer from banana fiber were shown in Table 5.
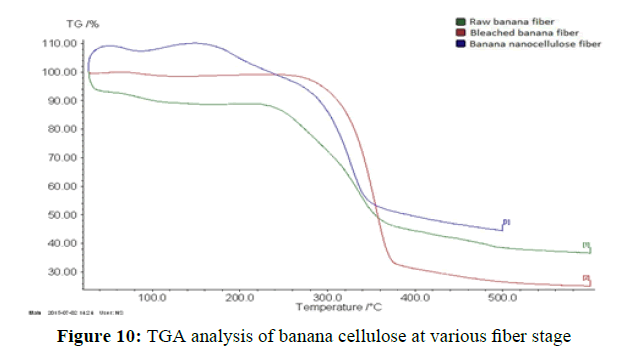
Figure 10: TGA analysis of banana cellulose at various fiber stage.
| Fiber Stage | Temperature (°C) | Mass change (%) | Residual (%) |
|---|---|---|---|
| Raw banana fiber | 23-230°C | 11.70% | 36.55% |
| 230-440°C | 45.98% | ||
| 440-600°C | 05.78% | ||
| Bleached banana fiber | 23-280°C | 01.91% | 25.10% |
| 280-520°C | 71.99% | ||
| 520-600°C | 01.03% | ||
| Nanocellulose Bio-synthesized from banana fiber | 23-300°C | 11.70% | 44.44% |
| 300-425°C | 41.04% | ||
| 425-600°C | 03.42% |
Table 5: Thermal analysis of cellulose fiber at different stage
The TGA analysis of bleached banana fiber shows very clear improvement in thermal property of banana fiber as compare to that of raw banana fiber. Bleached banana fiber shows the initial mass loss portion found from 23-280°C mainly caused by the evaporation of water from the cellulosic samples. No major thermal degradation occurred in this part about 1.90% only. This is reduced as compared to that of raw banana fiber mainly due to absence of lignin and pectin impurities which was present in raw stager. Further, the mass loss increased to about 260-520°C (Figure 10). Starting at this temperature where the mass loss deviated from the plateau region about 71.99% of mass loss is reported in this region due to cellulosic degradation. This indicates the presence of uniform cellulose without impurities in sample. Only 1.03% of loss in mass was found in III region. The residual remain after III region is 25.10%.
The TGA analysis of Nano cellulose from banana fiber shows initial gain of mass. This negligible gain at temperature 23-200°C may occurs due to swelling and agglomeration of mass due to nano structure of fiber. Excluding the mass gain Nano cellulose shows very less improvement in thermal property of banana fiber as compare to that of bleached banana fiber. Nano cellulose fiber shows the initial mass loss portion found from 23-300°C mainly caused by the evaporation of water from the cellulosic samples. Very low thermal degradation occurred in this part about 11.90% only. This is increased as compared to that of bleached banana fiber mainly due to nano structure of fiber. Further, the mass loss increased to about 260-425°C (Figure 10). Starting at this temperature where the mass loss deviated from the plateau region about 41.04 % of mass loss is reported in this region due to cellulosic degradation, this indicates the presence of uniform cellulose. In region I and II, two different degradation mechanisms were found (1) dehydration of cellulose by an endothermic process to produce “dehydrocellulose” between about 200 and 280°C and (2) DE polymerization of cellulose in competition with dehydration between 280 and 340°C, resulting in the formation of volatiles. Decomposition of dehydrocellulose formed in the first path into gases and char residue becomes dominant at about 320°C. Only 3.42 % of mass loss fount in III region. The residual remain after III region is 44.44%. In region III at a temperature above 500°C, the levoglucosan breaks down to provide a variety of low weight fission products, including hydrocarbons and hydrogen as occur in gas phase as further decomposition of levoglucosan, in the solid phase as the condensation and crosslinking of intermediate chars to highly condensed polycyclic aromatic structures or by interaction of both phases as gasification of char by reaction with H2O2 and CO2 at high temperatures to produce CO and H2.
Nano cellulose fibers were prepared by a novel eco-friendly and sustainable method using agriculture banana plant waste. A green enzymatic hydrolysis technique using Trichoderma reseei, banana plant waste material was converted in a potential bio medicinal textile material, i.e., NC fiber. This process yields 24% of NC fiber from raw banana fiber. The Nano cellulose fibers were highly stable in water medium, in gel form and also in solid white powder form. The average length and width of the synthesized NC was 551.4 nm and 53.94, as evaluated by particle size analyzer. The shape of obtained NC is needle rod like crystal shape as observed under polarized microscope and SEM. The elemental and chemical composition of produced NC confirms the presence of cellulose structure. The structure of raw banana fiber and biosynthesized Nano banana fibers was evaluated by XRD pattern confirms increase in crystallinity index as raw banana fiber converted in Nano crystalline cellulose fiber. TGA results also supports the change in crystallinity index by showing change in thermal degradation behavior. The TGA analysis of NC fiber was found in the region of 300°C to 425°C with mass change of 41.04%.Compard to the raw banana fiber and bleached banana fiber the TGA values in the range of 230-440°C and 280-520°C with mass change of 45.98% and 71.99 respectively. The viscosity and molecular weight of Nano cellulose was found 0.6 η and 18,354g.mol-1 with degree of polymerization value (DP) 114.