Research Article - Journal of Natural Product and Plant Resources ( 2017) Volume 7, Issue 3
Propolis is one of the honey bee products that possess various traditional medicinal and pharmaceutical applications owing to its wide range of biological activities. The chemical composition of propolis mainly depends on the plant sources utilized by bees for its manufacturing. Identifying the plant source of propolis is then necessary for its chemical standardization as well as for the beekeepers to provide their bees with the proper plants in their flight range. Propolis has been classified worldwide into at least six types according to geographical origin and surrounding vegetation. However, no previous investigation of the plant source of Egyptian propolis has been reported. Hence, the plant materials surrounding the beehive where propolis had been collected were extracted similarily to propolis using different solvents, and subjected to thin layer chromatography (TLC). The developed chromatograms after being revealed with different techniques were captured using digital camera as a digitizing tool and then evaluated using the image analysis software. The obtained digital densitograms were processed by multivariate data analysis software to explore the inherent correlation between propolis and the surrounding plant materials. The elaborated model succeeded in exploring, for the first time, that Eucalyptus globulus Labill. Tree leaves is the main plant source of Egyptian propolis collected from University of Alexandria Agricultural Research Farm, Apiculture Unit.
Egyptian propolis, Eucalyptus globulus Labill., Digitally-enhanced TLC, Image analysis, Multivariate data analysis.
Propolis, a honey bee product, is a resinous substance collected by Apis mellifera L. from various leaf buds and plant exudates. Bees utilize propolis for smoothing out internal hive walls and for sealing cracks and crevices in it [1]. Propolis has been used as a folk medicine since 300 B.C. [2]. Recently, numerous biological properties of propolis have been reported including cytotoxic [3,4], antiviral [5,6], antimicrobial [7,8] and free radical scavenging activity [9]. Because of the wide range of biological activities, propolis has gained a wide acceptance in popular medicine worldwide. Propolis is commercially used in many pharmaceutical products, food and beverages to improve health and prevent diseases [10].
Propolis is composed of 50% resin, 30% wax, 10% volatile compounds, 5% pollen, 5% other organic substances including amino acids and minerals [11]. The composition of propolis thus depends on the plant sources of this resin. The striking diversity of propolis chemical composition worldwide is mainly attributed to the local flora at the site of collection [12,13]. In spite of this diversity, at least six main propolis types had been reported according to surrounding vegetation and the geographic origin [13]. Poplar propolis from Populus spp. in Europe, North America and non-tropical regions of Asia [14], Birch propolis from Betula verrucosa Ehrh. in Russia [13], Green propolis from Baccharis spp. in Brazil [15], Red propolis from Clusia spp. in Cuba and Venezuela [16], Pacific propolis from Macaranga spp. in Pacific regions such as Japan and Taiwan [17] and Canarian propolis from unknown plant spp. in Canary island [18]. However, the plant source of Egyptian propolis has not been investigated yet.
Recognition of the plant sources utilized by bees for propolis manufacturing is useful as a basis for the chemical standardization of propolis and is not only of an academic interest [14]. Moreover, it is deemed necessary for beekeepers to provide their bees with the proper plants in their flight range, otherwise the bees may be enforced to collect harmful propolis substituents like asphalt, paints or mineral oils which will greatly affect the safety of propolis consumption [19]. Characterization of the plant source may be achieved by direct observation of forager bees during their journey of propolis collection which is certainly difficult, or by comparison of the chemical profiles of propolis and the surrounding plant materials by means of TLC, HPLC or GC [14]. Some studies claimed perfect matches between propolis chromatographic pattern and that of the plant materials [15,20-22]. Other studies reported a difference between their patterns which may be attributed to volatilization of some compounds during bee flight to the hive, or because the forager bees gather the propolis from a cocktail of different plants found in the vicinity of the colony [23]. Another clue that may cause that difference is that the forager bee mixes a self-secreted â-glucosidase with the collected plant material during its flight back to the hive [24].
The present study aims at establishing, for the first time, a scientific bench mark for the plant source(s) utilized by the forager bees for manufacturing of Egyptian propolis. Digitally- Enhanced TLC (DE-TLC) as an accurate, inexpensive and rapid technique was used to elaborate any matches between Egyptian propolis and the plant materials surrounding the colony. Multivariate data analysis was performed on the resulting digital densitograms of propolis and different surrounding plants, in order to explore any inherent correlations between them [25].
Collection of propolis and the surrounding plant materials
Propolis sample was collected from University of Alexandria Agricultural Research Farm, Abees. Apiculture Unit. In addition, the surrounding plant materials, such as the leafy tops of Pluchea dioscoridis (L.) DC., Gossypium barbadense L., Psidium guajava L., Eucalyptus globulus Labill., Morus alba L. and Salix alba L and the resinous exudates from Eucalyptus and Morus trunks were collected. All the plants were kindly identified in the department of Botany, Faculty of Science, and University of Alexandria. Propolis and the exudates were separately crushed while the plants were air-dried and powdered.
Extraction and preparation of sample solutions
Toluene extract of propolis (TEP)/Toluene extract of plant material (TEPM) sample solutions
Crushed propolis sample (500 mg), air-dried powdered plant materials and crushed resinous exudates (4.0 g each) were separately extracted twice by occasional shaking for 30 minutes with 30 ml of toluene. Toluene extracts were evaporated under reduced pressure, and the residues were dissolved in 8.0 ml of chloroform-methanol mixture 1:1 (v/v). These extracts contain mainly the non/weakly-polar constituents.
Methanol extract of propolis (MEP)/Methanol extract of plant material (MEPM) sample solutions
The same propolis and plant samples after being extracted with toluene were successively and similarly extracted with methanol twice, the obtained extracts were evaporated to dryness and the residues were dissolved in 8.0 ml chloroform-methanol 1:1 (v/v) mixture. These extracts contain mainly the moderately/strongly- polar constituents.
Hydrolyzed methanol extracts of plant materials (HMEPM) sample solutions
Since some studies owed the absence of any glycosides in propolis to the enzyme â-glucosidase secreted by the bees, it was deemed necessary to carry out a hydrolysis step to (MEPM) in order to convert any glycosides to their corresponding aglycones [24]. Hence, subjecting the collected plant constituents and propolis constituents to similar conditions. 4-ml portion of (MEPM) sample solution of each plant material was treated with 10 ml of 5% hydrochloric acid, boiled under reflux for 45 min., cooled and extracted in a separating funnel with two successive quantities, 15 ml each of ethyl acetate. The combined ethyl acetate was evaporated to dryness and the residue was dissolved in 4 ml methanol. These extracts were supposed to contain mainly the polar constituents of plant materials, but after hydrolysis of glycosides into their corresponding aglycones.
Digitally-enhanced TLC (DE-TLC)
TLC chromatographic parameters and conditions
Propolis and plant materials extracts sample solutions (6.0 μl) were applied on a silica gel 60 GF 254 Merck® layers (Darmstadt, Germany). TEP and TEPM in one TLC layer and MEP, MEPM and HMEPM in another layer by means of Camag (Wilmington, NC) Linomat IV automatic spray-on band applicator operated with the following settings: band length 6 mm; application rate 15 s/μl; distance between bands 4 mm; distance from the layer side edges 10 mm and distance from the bottom of the layer 15 mm. Linear ascending development of the layer was carried out in (10 x 20 cm) Camag TLC twin-trough chamber saturated with 25 ml of freshly prepared mobile phase for 30 min. at room temperature.
Development and visualization
The thin layer loaded with TEP and TEPM was developed using chloroform-methanol (19:1) as the developing solvent, while that loaded with MEP, MEPM and HMEPM was developed using chloroform-methanol (9:1). The layers were developed to a distance of 85 mm beyond the origin. After development, the layers were air-dried, and examined under UV lamp at ë 254 nm, and then the image was captured using digital camera under UV lamp. The TLC plates were then sprayed with p-anisaldehyde/sulphuric acid spray reagent prepared according to method of Stahl [25] and subsequent heating at 1050C for 8 minutes and then directly captured.
Image capturing and digitalization
Kodak® digital camera (C633) with 6.1 Mega pixels and (3×) optical zoom was used to photograph the TLC plates. During images capturing, each time the camera should be held at the same distance (20 cm) from the plate. The plates should be captured parallel to photo border to avoid skewing of the image. The captured images were stored as jpg file.
Image analysis software
SorbfilTLC® software (JSC Sorbpolymer) was used for densitometric analysis of the captured images. Multi-spectral scans were performed over the entire TLC plate to create a specific densitogram of each scanned track. Each image was opened, and then the number of tracks was assigned. For each track, the width and height were adjusted to accommodate all the spots. The sensitivity threshold for peak area measurement was set as the default value.
Electronic conversion of DE-TLC evaluation results into data matrix
After densitometric evaluation of all the tracks, the area under the peak recorded in the densitogram of each track were exported to Microsoft Excel 2010 (Microsoft, Washington, DC, USA) and then converted into a data matrix with the Rf values as variables represented by columns and the corresponding peak areas represented by rows.
Mutivariate data analysis
Unsupervised pattern recognition analysis was performed on the compiled data matrix using Simca 14.1 (Umetrics, Umea, Sweden). Principal Component Analysis (PCA) using four principle components imparted to the model was used as a tool for multivariate data analysis.
By thorough examination of the obtained chromatograms (Figures 1 and 2), it is absolutely obvious that there is no perfect matching between propolis extracts with any of the plant material extracts solely. Consequently, this propolis sample was certainly prepared from a cocktail of different plants rather than utilizing a single plant species for gathering the resin.
Owing to the difficulty in extracting information from the obtained chromatograms due to the high number of components in each track, it was deemed of value to use the DE-TLC technique coupled with multivariate data analysis. The digital images of the TLC plates obtained by digital camera as a digitizing tool are essentially made up of many rows and columns of dots called pixels that are considered as a matrix of numbers, were subsequently converted to corresponding digital densitograms (Figures 1 and 2) using the image analysis software.
a) Examination under UV lamp at ë 254 nm.
b) Spraying with anisaldehyde/sulphuric acid spray reagent and subsequent heating at 1050C for 8 minutes. Track 1: TEP, 2: TE of P. dioscoridis; 3: TE of G. barbadense; 4: TE of P. guajava; 5: TE of leaves of E. globulus; 6: TE of leaves of M. alba; 7: TE of leaves of S. alba; 8: TE of the resinous exudates of M. alba; 9: TE of the resinous exudates of E. globulus.
a) Examination under UV lamp at ë 254 nm.
b) Spraying with anisaldehyde/sulphuric acid spray reagent and subsequent heating at 1050C for 8 minutes. Track 1: MEP, 2, 3: ME, HME of P. dioscoridis; 4, 5: ME, HME of G. barbadense; 6, 7: ME, HME of P. guajava; 8, 9: ME, HME of leaves of E. globulus; 10, 11: ME, HME of leaves of M. alba; 12, 13: ME, HME of leaves of S. alba; 14: ME of the resinous exudates of M. alba, 15: ME of the resinous exudates of E. globulus.
In case of the TEP and TEPM, for both the images captured after examination under UV lamp at ë 254 nm (Figure 1a) and after spraying with anisaldehyde/sulphuric acid spray reagent (Figure 1), the peak areas of the spots of Rf 0.17, 0.39, 0.49, 0.6, 0.7, 0.76, 0.87 and 0.91 in each track were exported to the data matrix, whereas, for MEP, MEPM and HMEPM, for both images (Figure 2) the spots of Rf 0.38, 0.51, 0.62, 0.71 and 0.92 were exported, Hence, a total of 36 variables were utilized for constructing the data matrix, which, consequently subjected to multivariate data analysis.
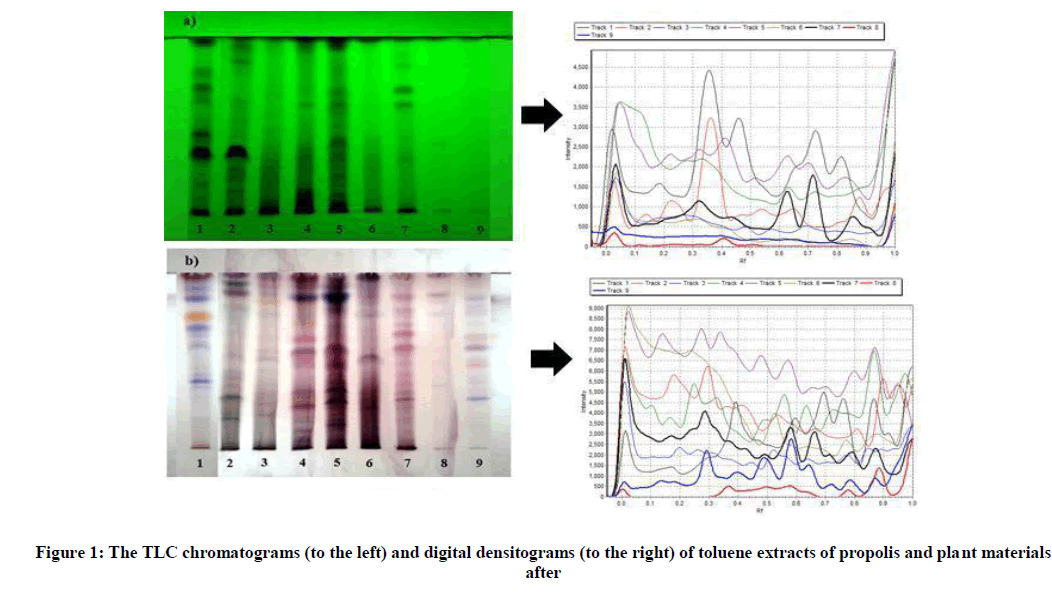
Figure 1: The TLC chromatograms (to the left) and digital densitograms (to the right) of toluene extracts of propolis and plant materials after.
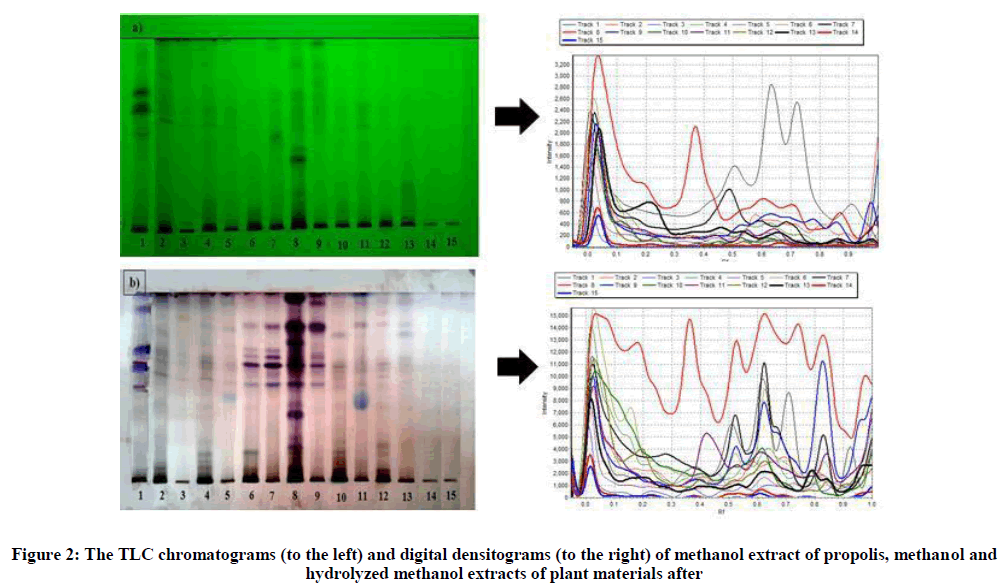
Figure 2: The TLC chromatograms (to the left) and digital densitograms (to the right) of methanol extract of propolis, methanol and hydrolyzed methanol extracts of plant materials after.
Principal Component Analysis (PCA) is used to reduce data dimensionality in multidimensional dataset and to allow the visualisation of underlying structure and relationship in a two dimensional representation using the scatter plot of the PCA scores. A PCA model (Figure 3) was constructed using four principal components, which account for 89% of the total variance.
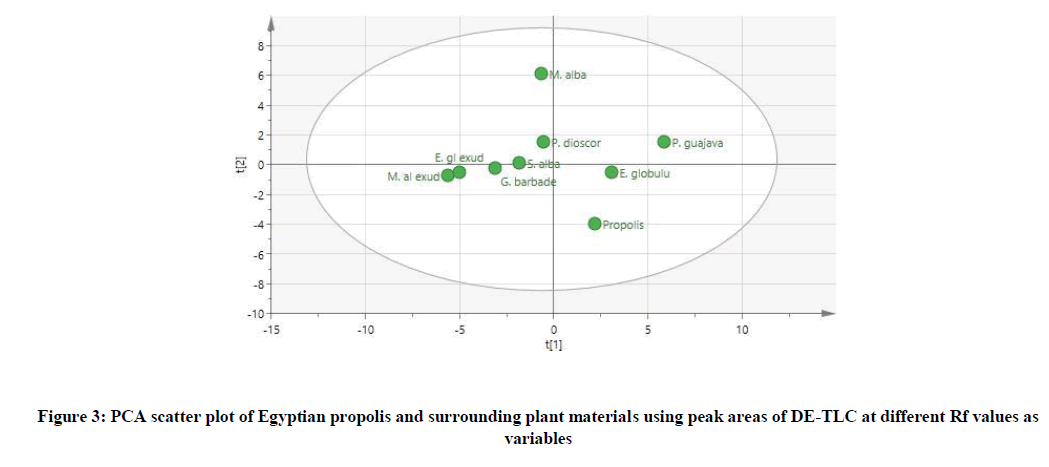
Figure 3: PCA scatter plot of Egyptian propolis and surrounding plant materials using peak areas of DE-TLC at different Rf values as variables.
By careful examination of the obtained scatter plot, it was noticed that Eucalyptus globulus Labill. was the closest plant to propolis with respect to both first and second principal components axes, suggesting it to be the principal ingredient for the bees to prepare propolis. It was also noticed that Psidium guajava L. present at the positive side of first principal component together with propolis and Eucalyptus globulus Labill. These findings directed us to suggest that the bees utilized an amalgam of Eucalyptus globulus Labill. mainly, and to lesser extent Psidium guajava L. tree leaves for manufacturing of Egyptian propolis.
This suggestion could be further substantiated by observing that most of the Egyptian apicultures have Eucalyptus globulus trees in the vicinity of the beehives, suggesting it to be the most likely principal plant source of Egyptian propolis.
The elaborated model which sequentially comprised of: digitizing the TLC chromatogram, revealed using different techniques, of propolis together with the surrounding plant materials, then Image analysis of the DE-TLC and converting them to digital densitograms and finally Multivariate data analysis using PCA to reduce the data dimensionality in the compiled multidimensional data matrix; Succeeded in exploring for the first time that Eucalyptus globulus Labill. tree leaves is the main plant source of Egyptian propolis.