Research Article - Archives of Applied Science Research ( 2018) Volume 10, Issue 2
The crystal structure and surface morphology of the CaTiO3:Sm3+ nanomaterials prepared by combustion synthesis were determined by XRD RigakuUltima IV diffractometer using Cu Kα radiation (1.54184 Å) depicting orthorhombic phase of CaTiO3:Sm3+ with space group Pbnm& scanning electron microscopy (SEM) respectively. The phosphor particles size was found about 10-15nm. Upon excitation using 407nm light, the PL emission spectra obtained due to 4f transition of Sm3+ from 4G5/2 → 6HJ(J=5/2, 7/2 ,9/2 ,11/2) consists of five peaks located at 564nm, 601-611nm, 647nm and 711 nm respectively. Among these Peaks, the peak located at 564 nm (4G5/2→6H5/2) was purely due to magnetic-dipole transition (MD), and at 648 nm (4G5/2→6H9/2) was purely due to electric dipole transition (ED). But the main peak located at 601 nm (4G5/2→6H7/2) was due to a partly magnetic and partly a force dielectric-dipole transition showing bright orange-red emission thus prove CaTiO3:Sm3+ phosphor a strong promising orange-red phosphor for display application.
CaTiO3:Sm3+, Nanomaterials, Orthorhombic, Magnetic-dipole, Electric-dipole
Introduction
Presently, the ABO3 typestitanates have been considered as an important class of perovskites because of their great candidature for electro-optical devices. Calcium titanate (CaTiO3) ceramics are excellent applicants for use as dielectric resonators in wireless communication system [1]. Calcium titanate i.e. CaTiO3 as a perovskite is chemically and thermally stable promising material at microwave frequencies due to high dielectric constant, high dielectric loss and large positive temperature co-efficient of the resonant frequency [2]. The selection of the rare earth ions as dopants is the key factor for the synthesis of photoluminescence materials. Among the different rare earth ions, the Sm3+ ion as a dopants was regarded as one of the most popular , efficient & promising doping ions to produce intense orange light in the visible wavelength range. The Sm3+ ion has 4f5 configuration and doubly degenerate for any crystal field perturbation [3]. Since samarium doped compounds show narrow line emission profile and a long life-time similar to europium compounds, and they can be used as a probe in multi analytical assays [4]. Recent literature reveals that samarium doped host materials provide strong orange red emission with different excitation wavelengths like 350 [5], 355 [6], 405 nm [7] etc. On the other hand, strontium titanate (SrTiO3) has its potential applications, such as dynamic random access memory, tunable microwave devices, photocatalysts and photoelectrodes for splitting water into hydrogen and oxygen [8–10]. In many applications like photocatalysts and inorganic phosphors, MTiO3 nano particles with narrow size distribution, non-agglomeration and spherical morphology are preferred [11]. When these luminescent materials are synthesized through the traditional hightemperature based method such as like co-precipitation, solid-state method [12], the product obtained is mostly found to be either of irregular morphology or agglomerate with serious reunion and high hardness, which directly affects the luminescence efficiency of the phosphors during the later milling. As we know every synthesis methods have some important effects on the material microstructure and physical properties. But the combustion synthesis [13] provides an interesting significance over other techniques because of its simplicity of experimental set-up; surprisingly short time between the preparation of reactants and the availability of the final product; and being cheap due to energy saving. The main advantage of combustion method is the rapid decomposition of the rare earth nitrates in the presence of an organic fuel. During the reaction, various kinds of gases likes CO2, N2, NO2 and H2O, as well as a large amount of heat are released in a short period of time before the process terminates with white, foamy and crispy products. A series of Ca1−xSmxTiO3 nanophosphors have been synthesized & effects of varying concentration of Sm3+ from 2 mol % to 10 mol% with increasing temperature from 550 to 1050°C to enhance the crystallinity& photoluminescence intensity of the phosphor have been investigated and the possible mechanism have been proposed. So this work has been carried out with the aim to prepare the high photoluminescence intensity nanosized crystalline powders of CaTiO3 doped with Sm3+ after sintering at 1050°C. The crystalline structure of prepared materials, surface morphology of particles and their photoluminescence properties are characterized by XRD, SEM and PL emission spectra using 407 nm lasers as a excitation source respectively. The color purity was verified by using the chromaticity diagram.
Synthesis of nano-material
Stoichiometric amount of highly purified Aldrich chemicals like [Ca(NO3)2], TiO2, [Sm(NO3)3], and hexamethylenetetramine (HMTA) as a combustion fuel were used as a starting materials for synthesis of phosphor with general formula Ca1−xTiO3:xSm3+ ,where x= 2 mol% to 10mol%. A series of phosphors were prepared by preheating a stoichiometric amount of above mentioned metal nitrates and fuel on a preheated hot plate maintained at 150 °C for 1h, where the mixture undergoes slow dehydration to produce a paste which further combusted at different temperature from 550°C to 1050°C in muffle furnace for 3h to enhance the crystallinity of the phosphor. Amount of HMTA was calculated using total oxidizing and reducing valencies [14]. The white solid product thus obtained by combustion was easily ground to a fine-sized powder by the pestle mortar and characterized by XRD, SEM, PL measurements & color chromaticity diagram.
The complete combustion reaction can be written as

Characterization of nano-material
The Crystal structure, Surface morphology and Photoluminescence intensity was characterized by X-ray diffraction (XRD) using RigakuUltima IV diffractometer, Scanning electron microscopy (SEM) using JEOL JSM6300 , UV lamp at 407 nm for excitation respectively. All measurements were carried out at room temperature. The color purity was verified by using the chromaticity diagram.
Crystal structure analysis
Figure 1 (a, b) depicts X-ray diffraction patterns of CaTiO3:Sm3+ (2–10 mol%) phosphors calcined at different temperature from 550 to 1050 0C for 3h was synthesized & recorded at room temperature. All the diffraction peaks were indicating towards the orthorhombic phase as shown in Figure 1. (c) of CaTiO3:Sm3+ with space group Pbnm, and the lattice parameter (Table 1) values were a = 0.8598 nm, b = 0.9761 nm, and c = 0.9159 nm (JCPDS Card No. 06-2149) [15,16]. It was noticed that at low doping concentration, Sm3+ has almost negligible effects on the CaTiO3 crystalline structure. But, higher Sm3+ doping concentration shifted the XRD peaks slightly towards lower angles, as depicted in the Figure 1(b), which indicates that Sm3+ ions were strongly packed into the crystal lattice of CaTiO3. The Sm3+ ions doping into the CaTiO3 lattice result in the expansion of the unit cell causing tensile stress, as a result the XRD peaks shifted either lower or higher angle side [17]. The peak shift and line broadening in XRD profiles arises due to the presence of microstrain in nanophosphors. Figure 1(a) shows the XRD patterns of undoped CaTiO3 lattice calcined at 550, 750, 850, 950 and 1050 0C for 3 h. It was observed that the intensity of the XRD patterns increases with increasing in calcination temperatures. The crystallite size was calculated from the most prominent XRD peaks (121) of the CaTiO3:Sm3+ phosphor using Scherer’s equation, d ¼ 0:9k=b cos h [18] where d; average crystallite size, k; the wavelength used, and b; full width at half maxima in radian. The average crystallite size was found to be 10 nm.
| Sm3+ conc. | a (Å) | b (Å) | c (Å) | Vol (Å3) | Particle Size (nm) |
|---|---|---|---|---|---|
|  2 mol% | 5.4368 | 5.3862 | 7.6418 | 223.78 | 25±5 |
|  3 mol% | 5.4408 | 5.3878 | 7.6446 | 224.08 | 20±5 |
|  5 mol% | 5.4387 | 5.3865 | 7.6436 | 223.93 | 15±5 |
|  7 mol% | 5.4411 | 5.387 | 7.6461 | 224.12 | 10±5 |
|  9 mol% | 5.4433 | 5.3956 | 7.6532 | 224.77 | 15±5 |
| 10 mol% | 5.4341 | 5.3908 | 7.6414 | 223.85 | 15±5 |
Table 1. Calculated lattice parameters of CaTiO3:Sm3+ nonmaterial.

Figure 1. (a) shows the XRD spectra of undoped CaTiO3 phosphor calcined at 550, 750, 850,950 and 1050 0C for 3 h. (b) With doping concentration of Sm3+ from 2 to 10 mol%.

Figure 1. (C) Show orthorhombic phase of CaTiO3:Sm3+ with space group Pbnm.
SEM analysis
Figure 2 (a, b) shows scanning electron micrographs of CaTiO3:Sm3+ (7mol %) prepared by combustion synthesis method. It was observed from micrographs that the phosphor consists of highly agglomerated, porous, irregular cubic shaped particles containing voids and cracks. This type of structure was obtained due to evolution of large amount of gases during combustion reaction [19]. The crystallite size was observed to be in the range 10 ± 5 nm.

Figure 2. SEM image of CaTiO3:Sm3+ (7 mol%).
Photoluminescence analysis
The photoluminescence depends on structural, electronic properties, compositional ordering, presence of impurities and defects [20] etc. Figure 3 (a) shows the excitation spectra of CaTiO3:Sm3+ phosphors by monitoring the emission at 601 nm due to the 4G5/2→6H7/2 transition. A group of sharp and intense lines were observed in the wavelength range 320–450 nm. The strongest sharp line located at 406 nm which corresponds to the Sm3+ f–f forbidden transitions of 6H5/2→4D3/2 (364 nm), 6H5/2→4D1/2(379 nm), 6H5/2→4F7/2 (407 nm),6H5/2→(6P, 4P)5/2 (421 nm), 6H5/2→4G9/2 (439nm), 6H5/2→4I13/2 (467 nm), 6H5/2→4I11/2 (480 nm) respectively [21]. These peaks are due to the transitions from the ground state to the excited states of Sm3+. Further an intense peak at 406 nm indicates that CaTiO3:Sm3+ phosphor was effectively excited by near ultraviolet light-emitting diodes. The emission spectra of CaTiO3:Sm3+ phosphor under excitation of 406 nm was shown in Figure 3(b) indicating the presence of four prominent groups of emission lines in the wavelength range of 540–740 nm, attributed to the intra 4f orbital transition from 4G5/2 (the ground level) to (the excited level) 6HJ (J = 5/2, 7/2, 9/2 ,11/2). The characteristic emission peaks at 564, 601, 611, 647 and 711 nm for the 4G5/2→6H5/2, 4G5/2→6H7/2, 4G5/2→6H9/2 , and 4G5/2→6H11/2 of Sm3+ transitions, respectively [22]. Among these emission peaks, peak at 601 nm due to transition from 4G5/2→6H7/2) was found to be strongest in the photoluminescence intensity thus satisfies the selection rule of ΔJ = ±1 , where J; the angular momentum. Magnetic dipole transition obey the selection rule of ΔJ = 0 and ±1 and electric dipole transitions only obey the selection rule of ΔJ 6 where J or J0 = 0 when J = 2, 3, 6 [23]. The peak at 601 nm (4G5/2→6H7/2) was a partly magnetic and partly a force dielectric-dipole transition. The peak at 564 nm (4G5/2→6H5/2) was a magnetic-dipole transition (MD), and the peak at 648 nm (4G5/2→6H9/2) was purely electric dipole transition (ED) which was sensitive to the crystal field [24]. It was very necessary to identify the optimum activator concentration [25] as the PL of the phosphors mainly depends on the concentration of activator ions. Hence in order to optimize the doped Sm3+ concentration in CaTiO3 host, the emission intensity at 564, 601, 647 and 711 nm as a function of Sm3+ activator concentration in CaTiO3 phosphors were studied as shown in Figure 3(c). The variation of PL emission intensity of Sm3+ with respect to different calcinations was studied and was shown in Figure 3(d). When temperature varied from 550 to 1050°C, the enhanced emission intensity was observed due to the improved crystallization of the products, thus decreasing the defect concentration and making greater uniform distribution of Sm3+ ions in the host lattices. It was noticed that the emission intensities were increased with gradual increase in the activator concentration 2 to 7 mol%, and there after it decreases due to concentration quenching. With increase of Sm3+ ion concentration the cross-relaxation between two neighboring Sm3+ ions became stronger and hence it quenches the emission intensity. The quenching mechanism [26] associated with the interaction between the excited ions, and the emission intensity per activator ion follows the equation (1) given below:
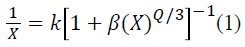

Figure 3a.(a) the excitation spectra of CaTiO3:Sm3+ phosphor & (b) the emission spectra of CaTiO3:Sm3+ phosphor.

Figure 3c.(c) Variation of intensity with different Sm3+ concentration & (d) Variation of intensity with different temperature.
where I; the integral intensity of emission spectra from 550 to 750 nm, X; the activator concentration, I/X; the emission intensity per activator (X), b and K; constants for a given host under same excitation condition. According to above equation, Q = 3 for the energy transfer among the nearest neighbor ions, while Q = 6, 8 and 10 for d–d, d–q and q–q interactions respectively [27]. The critical concentration of Sm3+ was determined to be 7 mol%. The plot of log (I/XSm3+) as function of log XSm3+ in CaTiO3:Sm3+ phosphor was obtained by using Dexter’s theory [28], and shown in Figure 4(a). The dependence of log (I/XSm3+) on log XSm3+ was linear and the slope was -0.958 and the Q value was found to be 6.784, which is 6, indicating that the concentration quenching of Sm3+ emission in the phosphor takes place due to d–d interaction. Generally, the intensity ratio of ED and MD (Asymmetry ratio, A21) transitions were used to measure the symmetry of the local environment of the trivalent 4f ions [24] which was sensitive to the nature of the Sm3+ ions environment in the host lattice. This provides a measure of the degree of distortion from inversion symmetry of the local environment surrounding the Sm3+ ions in the host matrix. Greater the intensity of the ED transition, the more the asymmetry nature. In our present work, the 4G5/2→6H5/2 (MD) transition of Sm3+ ions were more intense than 4G5/2→6H9/2 (ED) transition, indicating the symmetric nature of the CaTiO3:Sm3+ host matrix. To obtain the ratio between the intensities of the electric dipole transition and magnetic dipole transition the local symmetry was measured with the relative intensities of these two transitions. The larger value of this ratio more will be distortion from the inversion symmetry [29]. The obtained values were found to be in the range 0.94–1.12, depicting that the Sm3+ ions were mixed in cations environment of CaTiO3:Sm3+ phosphor very successfully rather than quite distorted states [30]. The values of A21 decrease with increase of Sm3+ ions concentration. But, it was observed that the doping of Sm3+ ions leads to lattice defects, thus reducing the symmetry strength of the local environment at Ca2+ sites. The structural changes with different Sm3+ ions concentration were monitored with change in the spectral widths of various emissions. But no significant change in the spectral width was observed indicating no change in the structural environment around the Sm3+ ions with increasing concentration, prove that the CaTiO3:Sm3+ nanophosphor possessed promising strong orange-red photonic applications.

Figure 4(a) Relationship between log (I/x) and logx of CaTiO3:Sm3+ nanophosphor and (b) CIE index diagram of CaTiO3:Sm3+ (2?10 mol%) nanophosphor.
Color purity analysis
The Commission International De I-Eclairage (CIE) 1931 chromaticity coordinates for CaTiO3:Sm3+ (2–10mol%) phosphors as a function of Sm3+ concentration for the luminous color was depicted by the PL spectra. The CIE chromaticity coordinates calculated from the PL spectra upon 407 nm excitation were shown in Figure 4 (b). The color purity was determined by the CIE co-ordinates of 2–10mol% Sm3+ activated CaTiO3:Sm3+ phosphor which were very close to the National Television System Committee (NTSC) standard values [31] and shown as a arrow mark in Figure 4(b). Thus, the phosphor proved its strong promising orange-red emissive application.
CaTiO3:Sm3+ (Sm = 2–10 mol%) nanomaterials were prepared by combustion method using HMTA as a combustion fuel. The average crystallite size was found to be in the range of 10–15 nm, which was also consistent with SEM results. The PL emission spectra was consists of intra 4f transitions of Sm3+ from 4G5/2→6H5/2, 4G5/2→6H7/2, 4G5/2→6H9/2 and 4G5/2→6H11/2 transitions, respectively. The transition (4G5/2→6H7/2) for main peak located at 601 nm was found to be hypersensitive in nature resulting in a strong orange–red emission. It was observed that the PL emission spectrum obtained upon excitation at 406 nm light was found very close to visible region (NUV) may be useful for LED applications. The phosphor show excellent CIE color co-ordinates (x ,y) value proving its color purity for its major use in the display applications.
Author is highly thankful to Department of Chemistry, M.D.U. Rohtak-124001, Haryana, India for providing the Chemical assistance and Lab equipments essentially required during synthesis of the nano-phosphor.